WunderBlog Archive » Dr. Ricky Rood's Climate Change Blog
Category 6 has moved! See the latest from Dr. Jeff Masters and Bob Henson here.When Students Listen: Atlantic Multi-decadal Oscillation
When Students Listen: Atlantic Multi-decadal Oscillation -
This week a student who took my class a couple of years ago and also helped me with my class this past term, Kevin Reed, wrote me a message that he remembered my commenting in class that the Atlantic Multi-decadal Oscillation might not be real. He made reference to a paper in Nature entitled Aerosols implicated as a prime driver of twentieth-century North Atlantic climate variability. A good thing about students is that they get to read all sorts of interesting things, send them back to me, and help me appear smarter than I am.
The term “Atlantic Multi-decadal Oscillation” (aka AMO) has been used to define the variation of sea surface temperature in the North Atlantic Ocean. What did I mean in class when I said “it might not be real?” There is no doubt that the temperature of the Atlantic Ocean varies, and as we take and accumulate measurements we identify extended times when the ocean is warmer or cooler than average. When these data are plotted, we see these warmer and cooler time spans persist for a few tens of years; hence, a multi-decadal oscillation. The plot below is taken from a good article in Wikipedia, and the plot was made from data that is available at the Earth Systems Research Laboratory.
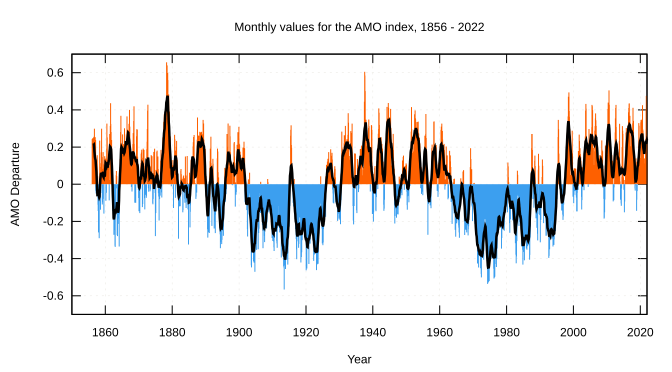
Figure 1: An area index that measures how much warmer or cooler the North Atlantic Ocean is from a long-term average (from Wikipedia). (The indices for the Atlantic Multi-decadal Oscillation are not especially well documented in the web resources that even a reasonably informed practitioner can find. The indices tend to be averages of the Atlantic surface temperatures from somewhere in the deep tropics to Greenland. They are then subtracted from long-term means. The 20th century mean is used in some papers. This example demonstrates some of foibles of data, data documentation, and data presentation on the web.)
The Atlantic Oceanographic and Meteorological Laboratory has a nice set of Frequently Asked Questions about the Atlantic Multi-decadal Oscillation.
I want to revisit this figure that I use as a template to think about the natural science of the Earth’s climate.

Figure 2: A summary figure I use to organize the basics of climate science and global warming.
A focus on the Atlantic Multi-decadal Oscillation is most naturally categorized in Figure 2 as “internal variability.” When we talk about global warming in the past 100 years and the next 100 years, internal variability usually refers to states of the atmosphere and ocean that are persistent for some amount of time – weeks, months, years, decades. For example, in El Nino the temperature of the ocean in tropical eastern Pacific is warm and stays warm for a few months or more. Then in La NIna the eastern Pacific is cool and stays cool for a few months or more. There is an easy feeling of the Earth oscillating back and forth between the warm and cool times in the eastern Pacific Ocean. For El Nino and La Nina, there are many related changes in atmospheric circulation (the trade winds change) and precipitation (tropical convention moves east and west). All of these related changes fit together, and they describe the atmospheric and ocean behaving as a coherent system. This coherent behavior allows us to understand cause and effect; it allows the possibility for prediction.
On a scale of a million years, the cycles between the ice ages and temperate times might be internal variability. This would be related to, for example, carbon dioxide coming into and out of the ocean due to changes in temperature and biology. So far, I have been diligent not to call internal variability “natural variability.” El Nino and La Nina are “natural,” but that does not mean that their behavior will remain the same as the climate warms. To call internal variability “natural” suggests this idea of a “natural” and a “manmade” climate that are two different things, and this idea is clearly not the case. We have our climate, there is internal variability, there is manmade warming, and they all occur together, and they will change together.
The Atlantic Multi-decadal Oscillation is internal variability. When I stand in front of class and say the Atlantic Multi-decadal Oscillation might not be real, I mean several things. At the foundation of my statement is that we don’t have this story of coherent behavior like we have in El Nino and La Nina; we don’t have a construction of the atmosphere and ocean behaving as a connected, dynamic system. In fact, I would argue that the issues I raise in the caption of Figure 1, for example mushy definitions of indices, indicate the challenges of the Atlantic Multi-decadal Oscillation. We know there is a signal, but it is even hard to describe that signal very well. When we link back to cause and effect, one of the leading ideas is that it is related to subtle changes of global scale ocean circulation, which we neither model nor observe very well. So I don’t say that the signal of the temperature change is unreal, but I suggest that the Atlantic Multi-decadal Oscillation is not a coherent sloshing back and forth between warm and cold.
One reason we are interested in the Atlantic Multi-decadal Oscillation is that we know that there are strong relationships between the temperature of the ocean in the tropical North Atlantic and drought and flood in North America and Africa. We know that warm Atlantic sea surface temperature is very highly linked to hurricanes in the United States. One of the scientists most quoted as a skeptic of the science of global warming, Bill Gray, bases much of his climate change argument on the role of Atlantic Multi-decadal Oscillation as a proxy for global climate. (For those who are interested, go back to Forms of Argument, and look at the focus on isolated information and reliance in this case on the reality of a process that is both hard to model and observe. How does this stand up in the face of all that we can observe?)
Back to the paper in Nature referenced in the first pargraph, Aerosols implicated as a prime driver of twentieth-century North Atlantic climate variability. This paper is a set of model simulations of the past century and a half. The simulations are associated with the Coupled Model Intercomparison Project Phase 5 (CMIP5). CMIP5 represents a coordinated set of simulations run by scientists around the world with the most recent production-ready climate models. I expect a set of interesting new results to be reported from these simulations especially with regard to the role of aerosols and land use in the climate. Aerosols, particulates in the atmosphere, have strong regional climate impacts, and are closely related to air quality – two of the other items listed in my Figure 2 template.
The point of Aerosols implicated as a prime driver of twentieth-century North Atlantic climate variability by Ben Booth and coauthors is that temperature changes associated with different amounts of aerosols at different times can explain the majority of the variability observed in the temperature of the North Atlantic Ocean. Natural sources of aerosols include volcanoes, which cool the Earth’s surface. Other natural sources are salt and soil dust. Manmade aerosols include pollutants, soot, and soil dust. (old Rood blogs - Volcanoes and Long Cycles, and Black Carbon) What aerosols do is to change the absorption and reflection of solar radiation; the absorption and reflection of clouds; and how efficiently heat is held near the Earth’s surface. In the simulations by Booth and others, the predominant impact of aerosols is related to effects on solar radiation – both directly by reflection (volcanoes) and indirectly by changes to clouds. Earlier studies have investigated the effect of volcanoes, and this study brings to the forefront the importance of other sources of aerosols, many of them manmade, in modulating global climate with strong regional influences.
The numerical experiments in Booth et al. (2012) are well designed. But they are complex, and, well, numerical experiments. I hold such numerical experimentation as an important part of scientific methodology of the 21st century. They help us think in a field where our ability to execute controlled experiments is limited. To me, these experiments suggest a strong, well-based explanation of the variability of North Atlantic temperatures. However, scientific method requires more scrutiny, more use of observations, and independent verification of the results. But as it stands right now, we have at hand a plausible explanation of cause and effect that explains the majority of the observed variability.
To finish another long article – The work of Booth et al. (2012) extends back to 1860. The Atlantic Multi-decadal Oscillation extends back, well seemingly, at least 8000 years. In Nature Communications there is an article Tracking the Atlantic Multidecadal Oscillation through the last 8,000 years by Mads Faurschou Knudsen and others (2011). This paper concludes that for most of the time since the last ice age ended, there has been a 50 – 70 year oscillation, which they attribute to atmospheric-oceanic coupled behavior modulated by variations in the orbit of the Earth. As I understand this paper, the authors tested whether or not variations in the Sun could explain their observed variability. Since solar variability did not explain their observations, they accepted the hypothesis that atmospheric-oceanic coupled behavior provided the explanation. They did not investigate the impact of aerosols.
As it stands in my mind today, the variability in the North Atlantic temperature behavior is strongly influenced by aerosols in the atmosphere and a trend due to increasing carbon dioxide. If there is oscillatory behavior in the temperature, it is due to increases and decreases in atmospheric aerosols, perhaps on top of a smaller atmospheric-oceanic dynamic variation that still requires explanation. A good step forward, I think.
r
This week a student who took my class a couple of years ago and also helped me with my class this past term, Kevin Reed, wrote me a message that he remembered my commenting in class that the Atlantic Multi-decadal Oscillation might not be real. He made reference to a paper in Nature entitled Aerosols implicated as a prime driver of twentieth-century North Atlantic climate variability. A good thing about students is that they get to read all sorts of interesting things, send them back to me, and help me appear smarter than I am.
The term “Atlantic Multi-decadal Oscillation” (aka AMO) has been used to define the variation of sea surface temperature in the North Atlantic Ocean. What did I mean in class when I said “it might not be real?” There is no doubt that the temperature of the Atlantic Ocean varies, and as we take and accumulate measurements we identify extended times when the ocean is warmer or cooler than average. When these data are plotted, we see these warmer and cooler time spans persist for a few tens of years; hence, a multi-decadal oscillation. The plot below is taken from a good article in Wikipedia, and the plot was made from data that is available at the Earth Systems Research Laboratory.
Figure 1: An area index that measures how much warmer or cooler the North Atlantic Ocean is from a long-term average (from Wikipedia). (The indices for the Atlantic Multi-decadal Oscillation are not especially well documented in the web resources that even a reasonably informed practitioner can find. The indices tend to be averages of the Atlantic surface temperatures from somewhere in the deep tropics to Greenland. They are then subtracted from long-term means. The 20th century mean is used in some papers. This example demonstrates some of foibles of data, data documentation, and data presentation on the web.)
The Atlantic Oceanographic and Meteorological Laboratory has a nice set of Frequently Asked Questions about the Atlantic Multi-decadal Oscillation.
I want to revisit this figure that I use as a template to think about the natural science of the Earth’s climate.
Figure 2: A summary figure I use to organize the basics of climate science and global warming.
A focus on the Atlantic Multi-decadal Oscillation is most naturally categorized in Figure 2 as “internal variability.” When we talk about global warming in the past 100 years and the next 100 years, internal variability usually refers to states of the atmosphere and ocean that are persistent for some amount of time – weeks, months, years, decades. For example, in El Nino the temperature of the ocean in tropical eastern Pacific is warm and stays warm for a few months or more. Then in La NIna the eastern Pacific is cool and stays cool for a few months or more. There is an easy feeling of the Earth oscillating back and forth between the warm and cool times in the eastern Pacific Ocean. For El Nino and La Nina, there are many related changes in atmospheric circulation (the trade winds change) and precipitation (tropical convention moves east and west). All of these related changes fit together, and they describe the atmospheric and ocean behaving as a coherent system. This coherent behavior allows us to understand cause and effect; it allows the possibility for prediction.
On a scale of a million years, the cycles between the ice ages and temperate times might be internal variability. This would be related to, for example, carbon dioxide coming into and out of the ocean due to changes in temperature and biology. So far, I have been diligent not to call internal variability “natural variability.” El Nino and La Nina are “natural,” but that does not mean that their behavior will remain the same as the climate warms. To call internal variability “natural” suggests this idea of a “natural” and a “manmade” climate that are two different things, and this idea is clearly not the case. We have our climate, there is internal variability, there is manmade warming, and they all occur together, and they will change together.
The Atlantic Multi-decadal Oscillation is internal variability. When I stand in front of class and say the Atlantic Multi-decadal Oscillation might not be real, I mean several things. At the foundation of my statement is that we don’t have this story of coherent behavior like we have in El Nino and La Nina; we don’t have a construction of the atmosphere and ocean behaving as a connected, dynamic system. In fact, I would argue that the issues I raise in the caption of Figure 1, for example mushy definitions of indices, indicate the challenges of the Atlantic Multi-decadal Oscillation. We know there is a signal, but it is even hard to describe that signal very well. When we link back to cause and effect, one of the leading ideas is that it is related to subtle changes of global scale ocean circulation, which we neither model nor observe very well. So I don’t say that the signal of the temperature change is unreal, but I suggest that the Atlantic Multi-decadal Oscillation is not a coherent sloshing back and forth between warm and cold.
One reason we are interested in the Atlantic Multi-decadal Oscillation is that we know that there are strong relationships between the temperature of the ocean in the tropical North Atlantic and drought and flood in North America and Africa. We know that warm Atlantic sea surface temperature is very highly linked to hurricanes in the United States. One of the scientists most quoted as a skeptic of the science of global warming, Bill Gray, bases much of his climate change argument on the role of Atlantic Multi-decadal Oscillation as a proxy for global climate. (For those who are interested, go back to Forms of Argument, and look at the focus on isolated information and reliance in this case on the reality of a process that is both hard to model and observe. How does this stand up in the face of all that we can observe?)
Back to the paper in Nature referenced in the first pargraph, Aerosols implicated as a prime driver of twentieth-century North Atlantic climate variability. This paper is a set of model simulations of the past century and a half. The simulations are associated with the Coupled Model Intercomparison Project Phase 5 (CMIP5). CMIP5 represents a coordinated set of simulations run by scientists around the world with the most recent production-ready climate models. I expect a set of interesting new results to be reported from these simulations especially with regard to the role of aerosols and land use in the climate. Aerosols, particulates in the atmosphere, have strong regional climate impacts, and are closely related to air quality – two of the other items listed in my Figure 2 template.
The point of Aerosols implicated as a prime driver of twentieth-century North Atlantic climate variability by Ben Booth and coauthors is that temperature changes associated with different amounts of aerosols at different times can explain the majority of the variability observed in the temperature of the North Atlantic Ocean. Natural sources of aerosols include volcanoes, which cool the Earth’s surface. Other natural sources are salt and soil dust. Manmade aerosols include pollutants, soot, and soil dust. (old Rood blogs - Volcanoes and Long Cycles, and Black Carbon) What aerosols do is to change the absorption and reflection of solar radiation; the absorption and reflection of clouds; and how efficiently heat is held near the Earth’s surface. In the simulations by Booth and others, the predominant impact of aerosols is related to effects on solar radiation – both directly by reflection (volcanoes) and indirectly by changes to clouds. Earlier studies have investigated the effect of volcanoes, and this study brings to the forefront the importance of other sources of aerosols, many of them manmade, in modulating global climate with strong regional influences.
The numerical experiments in Booth et al. (2012) are well designed. But they are complex, and, well, numerical experiments. I hold such numerical experimentation as an important part of scientific methodology of the 21st century. They help us think in a field where our ability to execute controlled experiments is limited. To me, these experiments suggest a strong, well-based explanation of the variability of North Atlantic temperatures. However, scientific method requires more scrutiny, more use of observations, and independent verification of the results. But as it stands right now, we have at hand a plausible explanation of cause and effect that explains the majority of the observed variability.
To finish another long article – The work of Booth et al. (2012) extends back to 1860. The Atlantic Multi-decadal Oscillation extends back, well seemingly, at least 8000 years. In Nature Communications there is an article Tracking the Atlantic Multidecadal Oscillation through the last 8,000 years by Mads Faurschou Knudsen and others (2011). This paper concludes that for most of the time since the last ice age ended, there has been a 50 – 70 year oscillation, which they attribute to atmospheric-oceanic coupled behavior modulated by variations in the orbit of the Earth. As I understand this paper, the authors tested whether or not variations in the Sun could explain their observed variability. Since solar variability did not explain their observations, they accepted the hypothesis that atmospheric-oceanic coupled behavior provided the explanation. They did not investigate the impact of aerosols.
As it stands in my mind today, the variability in the North Atlantic temperature behavior is strongly influenced by aerosols in the atmosphere and a trend due to increasing carbon dioxide. If there is oscillatory behavior in the temperature, it is due to increases and decreases in atmospheric aerosols, perhaps on top of a smaller atmospheric-oceanic dynamic variation that still requires explanation. A good step forward, I think.
r
The views of the author are his/her own and do not necessarily represent the position of The Weather Company or its parent, IBM.