WunderBlog Archive » Dr. Ricky Rood's Climate Change Blog
Category 6 has moved! See the latest from Dr. Jeff Masters and Bob Henson here.The whole silly warming pause, warming hiatus thing
The whole silly warming pause, warming hiatus thing: Bumps and Wiggles (9)
I want to finish my start-of-the-semester important research findings with my synthesis of the knowledge we have about the pause or hiatus in warming. In my little collection of blogs, I have written about this several times, and I link some of those entries below. Sometime in 2005, those in the lobby opposing climate-change science started to beat the drum that warming of the planet had stopped and that the assessments of the Intergovernmental Panel on Climate Change (IPCC) were in fundamental error. The drumbeat was amplified by a knowledge-twisting article in the Daily Mail, which I discussed in It’s Not Getting Warmer – Again, Really? Increased credibility to the pause in warming was added by an article in The Economist reporting on the story of the “pause” and that, indeed, if you looked at the temperature record it was not documenting an unrelenting increase in global-average surface temperature (from when the Economist article was published).
When I first wrote about the warming pause, I referred to my piece Form of Argument on how to analyze this news report. The article focused on a single piece of information, isolated, and posed as an unanswerable contradiction. The reporting and figures did not carry the full descriptions of the graphs that proved no warming. There were also implications of stealth. The list goes on. The warming hiatus as a challenge to the body of science-based knowledge on climate change was a manufactured problem.
The planet is warming from the trapping of energy near the Earth’s surface. It is reasonable to expect the average surface temperature to increase; it has and it will (Just Temperature). However, the heat being accumulated does not have to go only to increasing the average surface temperature. Some of that heat has been melting glaciers, sea ice and ice sheets. In addition, much of that heat has been heating the ocean, causing it to expand and further raising sea level. Energy goes into motions in the atmosphere and ocean. As for temperature of the surface, the Arctic is warming at an alarming rate; the temperature does not change uniformly over the Earth’s surface. The graphs isolated to substantiate the warming pause don’t challenge the entire body of research. They only raise questions about that particular graph, the underlying knowledge used in the construction of that graph and whether or not that graph is being presented in a way consistent with its underlying knowledge. There are also questions about that graph as a communication tool – both to convey that the climate is warming and to prove that it is not.
No doubt, the discrepancies between global-average surface temperature and the same quantity calculated from model projections require attention. The need to explain the bumps and wiggles in the global average temperature is an important scientific exercise; it is one of research elements to improve predictive skill. This was the subject of my Bumps and Wiggles Series and specifically Some Jobs for Models. From a science-based perspective, discrepancies of the type in this graph don’t threaten the body of knowledge of climate science, because they don’t represent the body of knowledge of climate change. From a science-based perspective, the discrepancies in the graph are clues for growing the body of knowledge. Any challenge to the body of knowledge comes from either a deliberate or ignorant misrepresentation of information and its implications.
What I present below is a small synthesis of some of the research that has taken place to explain the warming pause / hiatus. Here is a picture (Figure 1) of the hiatus from the Economist article.
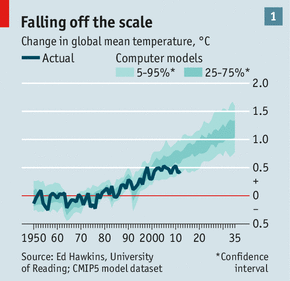
In Figure 1, the warming pause is the leveling off of the rise in temperature after that big peak in the late 1990s, about 1998 to be precise. The blue-shaded area is the temperature taken from an ensemble of models reported in the IPCC reports.
My climate-change course does not rely on equations, but I contend that it’s solidly anchored in science-based reasoning. I broke my students into groups and I asked for an analysis of the graph in Figure 1. After about 15 minutes, they came up with a list of items that needed to be addressed. One item on the list was that given the very definition of climate as a 30-year average, did it make sense to look at a 10-year trend? Were the surface-temperature measurements distributed properly to sample the warming in the Arctic? There were even questions about the objectivity of the chart maker. These are basic questions of scientific method.
There was another line of questions about whether the sunspot cycle might have an influence and if there had been changes related to reflection from aerosols, the particles in the atmosphere that absorb and reflect energy. These are ways the energy budget might be altered. There were questions of internal variability, especially that big spike in 1998, a known large El Nino warming. Shouldn’t that variability be removed so that a trend might be more confidently isolated? Could the ocean be a buffer? Are the models expected to represent El Nino and other types of internal variability on a case-by-case basis?
These are science-based questions. They pose no challenge to entirety of the climate-science knowledge base.
If we look into the scientific literature, there is a paper by Cowtan and Way (2014), entitled “Coverage Bias in the HadCRUT4 Temperature Series and its Impact on Recent Temperature Trends.” This paper does investigate the sampling of the surface temperature observations and, indeed, there are impacts on the temperature trend. They have been underestimated. Thompson et al. (2009) wrote “Identifying Signatures of Natural Climate Variability in Time Series of Global-Mean Surface Temperature: Methodology and Insights.” In this paper, they account for El Nino, which exposes the changes in temperature due to volcanoes. After extracting these signals to reveal the trends, their conclusions include “Filtering global-mean temperature time series to remove the effects of known sources of natural variability enriches the signal of the anthropogenically induced warming over the past century. The trends in the raw and residual data for the period January 1950–March 2009 are comparable (~0.12 K / decade); but the standard deviation of the (detrended) residual data is only 2/3 as large as the standard deviation of the raw data (~0.10 versus ~0.15 K).” The uncertainty in the trends has been reduced.
The point I want to make is that there are studies focused on the scientific questions that my students raised. Many of these papers have been reported on in the blogosphere, individually touted as proof or deconstructed in isolation for their shortcomings. Collectively, they are a systematic investigation of the “pause” in warming. Collectively, they tell a coherent and convergent story of a warming planet.
In the previous two blogs, I have mentioned the paper of Trenberth and Fasullo (2013), who are following the heat of the warming earth, with the primary goal of understanding of how much heat is contributing to warming the Earth’s surface-air temperature versus how much is going to heating the ocean and melting ice and snow. Their focus is on approximately the past 15 years. Therefore, they pay attention to known ways that the atmosphere and ocean vary (Some previous Rood tutorials: Still Following the Heat and Ocean, Atmosphere, Ice and Land). Trenberth and Fasullo document the strong influence of the 1997-1998 El Nino. El Nino has a large effect on global temperature. The 1997-1998 El Nino was especially large. Trenberth and Fasullo show that the temperature in the atmosphere and oceans still remembers the 1997-1998 El Nino. They also examine the Interdecadal Pacific Oscillation, which is characterized by sea surface temperature differences being above (or below) average in the north-central Pacific, while they are below (or above) in the north and east Pacific near the Aleutian Islands and the Gulf of Alaska. The Interdecadal Pacific Oscillation has been in a pattern of being cooler than average in the north and east Pacific since the 1997-1998 El Nino.
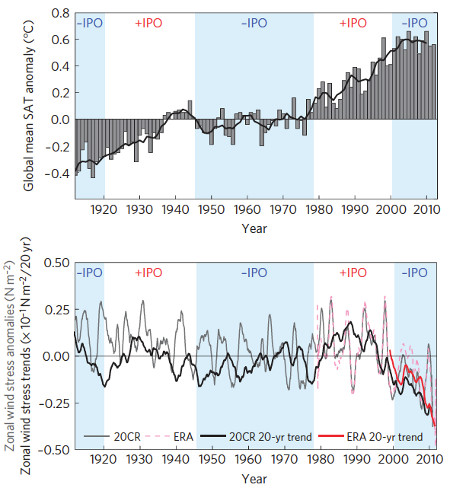
In another paper focused on the Pacific Ocean, England et al. 2014 investigate an extended period of strong trade winds. These strong trade winds have kept the eastern Pacific in a sustained cool period. The Pacific is so large, that the cool surface reduces the global-average temperature. England et al. present a suggestive figure of the Interdecadal Pacific Oscillation (IPO) and the global temperature record. (Figure 2: Top frame: Global surface temperature anomalies. Bottom frame: Pacific wind stress anomalies. From England et al., 2014) The suggested relation is that in the positive (warm eastern Pacific, +IPO in Figure) the temperatures rise rapidly. In the negative cool phase (cool eastern Pacific, -IPO), the temperature rise is halted. Note that it has not been declining. Their analysis accounts “… for much of the hiatus in surface warming observed since 2001. This hiatus could persist for much of the present decade if the trade wind trends continue; however, rapid warming is expected to resume once the anomalous wind trends abate.”
This body of research focused on understanding the pause or hiatus in warming is quite impressive. The consistent story that is emerging is, in fact, worrisome from the point of view of planetary temperature. It is virtually certain that the warm water in the western Pacific Ocean will, once again, move into the eastern Pacific. At this time, there will be a spike in the temperature increase.
The lobby opposing climate-change science is fundamentally political. A political tactic is the deliberate, distorted misrepresentation of information and its implications. It is effectively disruptive. It is not a threat to the science-based knowledge we have of our climate. It is, however, a much deeper threat to us all.
r
I want to finish my start-of-the-semester important research findings with my synthesis of the knowledge we have about the pause or hiatus in warming. In my little collection of blogs, I have written about this several times, and I link some of those entries below. Sometime in 2005, those in the lobby opposing climate-change science started to beat the drum that warming of the planet had stopped and that the assessments of the Intergovernmental Panel on Climate Change (IPCC) were in fundamental error. The drumbeat was amplified by a knowledge-twisting article in the Daily Mail, which I discussed in It’s Not Getting Warmer – Again, Really? Increased credibility to the pause in warming was added by an article in The Economist reporting on the story of the “pause” and that, indeed, if you looked at the temperature record it was not documenting an unrelenting increase in global-average surface temperature (from when the Economist article was published).
When I first wrote about the warming pause, I referred to my piece Form of Argument on how to analyze this news report. The article focused on a single piece of information, isolated, and posed as an unanswerable contradiction. The reporting and figures did not carry the full descriptions of the graphs that proved no warming. There were also implications of stealth. The list goes on. The warming hiatus as a challenge to the body of science-based knowledge on climate change was a manufactured problem.
The planet is warming from the trapping of energy near the Earth’s surface. It is reasonable to expect the average surface temperature to increase; it has and it will (Just Temperature). However, the heat being accumulated does not have to go only to increasing the average surface temperature. Some of that heat has been melting glaciers, sea ice and ice sheets. In addition, much of that heat has been heating the ocean, causing it to expand and further raising sea level. Energy goes into motions in the atmosphere and ocean. As for temperature of the surface, the Arctic is warming at an alarming rate; the temperature does not change uniformly over the Earth’s surface. The graphs isolated to substantiate the warming pause don’t challenge the entire body of research. They only raise questions about that particular graph, the underlying knowledge used in the construction of that graph and whether or not that graph is being presented in a way consistent with its underlying knowledge. There are also questions about that graph as a communication tool – both to convey that the climate is warming and to prove that it is not.
No doubt, the discrepancies between global-average surface temperature and the same quantity calculated from model projections require attention. The need to explain the bumps and wiggles in the global average temperature is an important scientific exercise; it is one of research elements to improve predictive skill. This was the subject of my Bumps and Wiggles Series and specifically Some Jobs for Models. From a science-based perspective, discrepancies of the type in this graph don’t threaten the body of knowledge of climate science, because they don’t represent the body of knowledge of climate change. From a science-based perspective, the discrepancies in the graph are clues for growing the body of knowledge. Any challenge to the body of knowledge comes from either a deliberate or ignorant misrepresentation of information and its implications.
What I present below is a small synthesis of some of the research that has taken place to explain the warming pause / hiatus. Here is a picture (Figure 1) of the hiatus from the Economist article.
In Figure 1, the warming pause is the leveling off of the rise in temperature after that big peak in the late 1990s, about 1998 to be precise. The blue-shaded area is the temperature taken from an ensemble of models reported in the IPCC reports.
My climate-change course does not rely on equations, but I contend that it’s solidly anchored in science-based reasoning. I broke my students into groups and I asked for an analysis of the graph in Figure 1. After about 15 minutes, they came up with a list of items that needed to be addressed. One item on the list was that given the very definition of climate as a 30-year average, did it make sense to look at a 10-year trend? Were the surface-temperature measurements distributed properly to sample the warming in the Arctic? There were even questions about the objectivity of the chart maker. These are basic questions of scientific method.
There was another line of questions about whether the sunspot cycle might have an influence and if there had been changes related to reflection from aerosols, the particles in the atmosphere that absorb and reflect energy. These are ways the energy budget might be altered. There were questions of internal variability, especially that big spike in 1998, a known large El Nino warming. Shouldn’t that variability be removed so that a trend might be more confidently isolated? Could the ocean be a buffer? Are the models expected to represent El Nino and other types of internal variability on a case-by-case basis?
These are science-based questions. They pose no challenge to entirety of the climate-science knowledge base.
If we look into the scientific literature, there is a paper by Cowtan and Way (2014), entitled “Coverage Bias in the HadCRUT4 Temperature Series and its Impact on Recent Temperature Trends.” This paper does investigate the sampling of the surface temperature observations and, indeed, there are impacts on the temperature trend. They have been underestimated. Thompson et al. (2009) wrote “Identifying Signatures of Natural Climate Variability in Time Series of Global-Mean Surface Temperature: Methodology and Insights.” In this paper, they account for El Nino, which exposes the changes in temperature due to volcanoes. After extracting these signals to reveal the trends, their conclusions include “Filtering global-mean temperature time series to remove the effects of known sources of natural variability enriches the signal of the anthropogenically induced warming over the past century. The trends in the raw and residual data for the period January 1950–March 2009 are comparable (~0.12 K / decade); but the standard deviation of the (detrended) residual data is only 2/3 as large as the standard deviation of the raw data (~0.10 versus ~0.15 K).” The uncertainty in the trends has been reduced.
The point I want to make is that there are studies focused on the scientific questions that my students raised. Many of these papers have been reported on in the blogosphere, individually touted as proof or deconstructed in isolation for their shortcomings. Collectively, they are a systematic investigation of the “pause” in warming. Collectively, they tell a coherent and convergent story of a warming planet.
In the previous two blogs, I have mentioned the paper of Trenberth and Fasullo (2013), who are following the heat of the warming earth, with the primary goal of understanding of how much heat is contributing to warming the Earth’s surface-air temperature versus how much is going to heating the ocean and melting ice and snow. Their focus is on approximately the past 15 years. Therefore, they pay attention to known ways that the atmosphere and ocean vary (Some previous Rood tutorials: Still Following the Heat and Ocean, Atmosphere, Ice and Land). Trenberth and Fasullo document the strong influence of the 1997-1998 El Nino. El Nino has a large effect on global temperature. The 1997-1998 El Nino was especially large. Trenberth and Fasullo show that the temperature in the atmosphere and oceans still remembers the 1997-1998 El Nino. They also examine the Interdecadal Pacific Oscillation, which is characterized by sea surface temperature differences being above (or below) average in the north-central Pacific, while they are below (or above) in the north and east Pacific near the Aleutian Islands and the Gulf of Alaska. The Interdecadal Pacific Oscillation has been in a pattern of being cooler than average in the north and east Pacific since the 1997-1998 El Nino.
In another paper focused on the Pacific Ocean, England et al. 2014 investigate an extended period of strong trade winds. These strong trade winds have kept the eastern Pacific in a sustained cool period. The Pacific is so large, that the cool surface reduces the global-average temperature. England et al. present a suggestive figure of the Interdecadal Pacific Oscillation (IPO) and the global temperature record. (Figure 2: Top frame: Global surface temperature anomalies. Bottom frame: Pacific wind stress anomalies. From England et al., 2014) The suggested relation is that in the positive (warm eastern Pacific, +IPO in Figure) the temperatures rise rapidly. In the negative cool phase (cool eastern Pacific, -IPO), the temperature rise is halted. Note that it has not been declining. Their analysis accounts “… for much of the hiatus in surface warming observed since 2001. This hiatus could persist for much of the present decade if the trade wind trends continue; however, rapid warming is expected to resume once the anomalous wind trends abate.”
This body of research focused on understanding the pause or hiatus in warming is quite impressive. The consistent story that is emerging is, in fact, worrisome from the point of view of planetary temperature. It is virtually certain that the warm water in the western Pacific Ocean will, once again, move into the eastern Pacific. At this time, there will be a spike in the temperature increase.
The lobby opposing climate-change science is fundamentally political. A political tactic is the deliberate, distorted misrepresentation of information and its implications. It is effectively disruptive. It is not a threat to the science-based knowledge we have of our climate. It is, however, a much deeper threat to us all.
r
Climate Change News Climate Change
The views of the author are his/her own and do not necessarily represent the position of The Weather Company or its parent, IBM.