WunderBlog Archive » Category 6™
Category 6 has moved! See the latest from Dr. Jeff Masters and Bob Henson here.El Niño of 2015 Hits All-Time Record Strength for a 1-Week Period
Incredibly warm waters continue to build across the equatorial Pacific, and the El Niño event of 2015 has just set a record for the warmest waters ever observed in the equatorial Pacific over a 1-week period. Sea-surface temperatures (SSTs) in the Pacific’s Niño3.4 region, between 90°W and 160°E longitude and 5° north/south latitude, are considered the benchmark for rating the strength of an El Niño event. The weekly departure of SST from average in this region hit +3.0°C (5.4°F) over the past week, NOAA announced in their November 16 El Niño update. This exceeds the previous 1-week record warmth in the equatorial Pacific of 2.8°C above average set during the week of November 26, 1997; accurate El Niño records extend back to 1950. However, the standard measure for the strength of an El Niño event is the three-month average Niño 3.4 SSTs, and the El Niño of 2015 is not yet officially considered the strongest on record. The August-September-October 2015 three-month average Niño 3.4 SSTs were 1.7°C above average, good for only the 2nd warmest on record, behind 1997. Judging from the trajectory of SST anomalies in Figure 1, though, it is likely that one of the late-year three-month average Niño 3.4 SST values in 2015 will end up upending 1997's record warmth and claim for the 2015 the title as strongest El Niño event on record. El Niño can't get much stronger than it is now, though, since there simply isn't enough warm water available in the Western Pacific to transport to the Eastern Pacific; wunderblogger Steve Gregory speculated in his Friday post that El Niño may now be peaking, and will begin a slow decline over the the next three months. Even so, El Niño will decline only gradually, and we can expect significant global impacts on weather during the coming winter. Below, I'll dive into some of the major non-U.S. impacts we can expect (and have already seen) from a strong El Niño; Bob Henson has covered the likely U.S. impacts in a number of previous posts, which are linked at the bottom of the blog.

Figure 1. Sea-surface temperatures (SSTs) in the Pacific’s Niño3.4 region, between 90°W and 160°E longitude and 5° north/south latitude, are considered the benchmark for rating the strength of an El Niño event. The weekly departure of SST from average in this region hit +3.0°C (5.4°F) over the past week, beating the previous record of +2.8°C set during November 1997 during that year's super-El Niño. Image credit: Jan Null Golden Gate Weather, via Twitter.

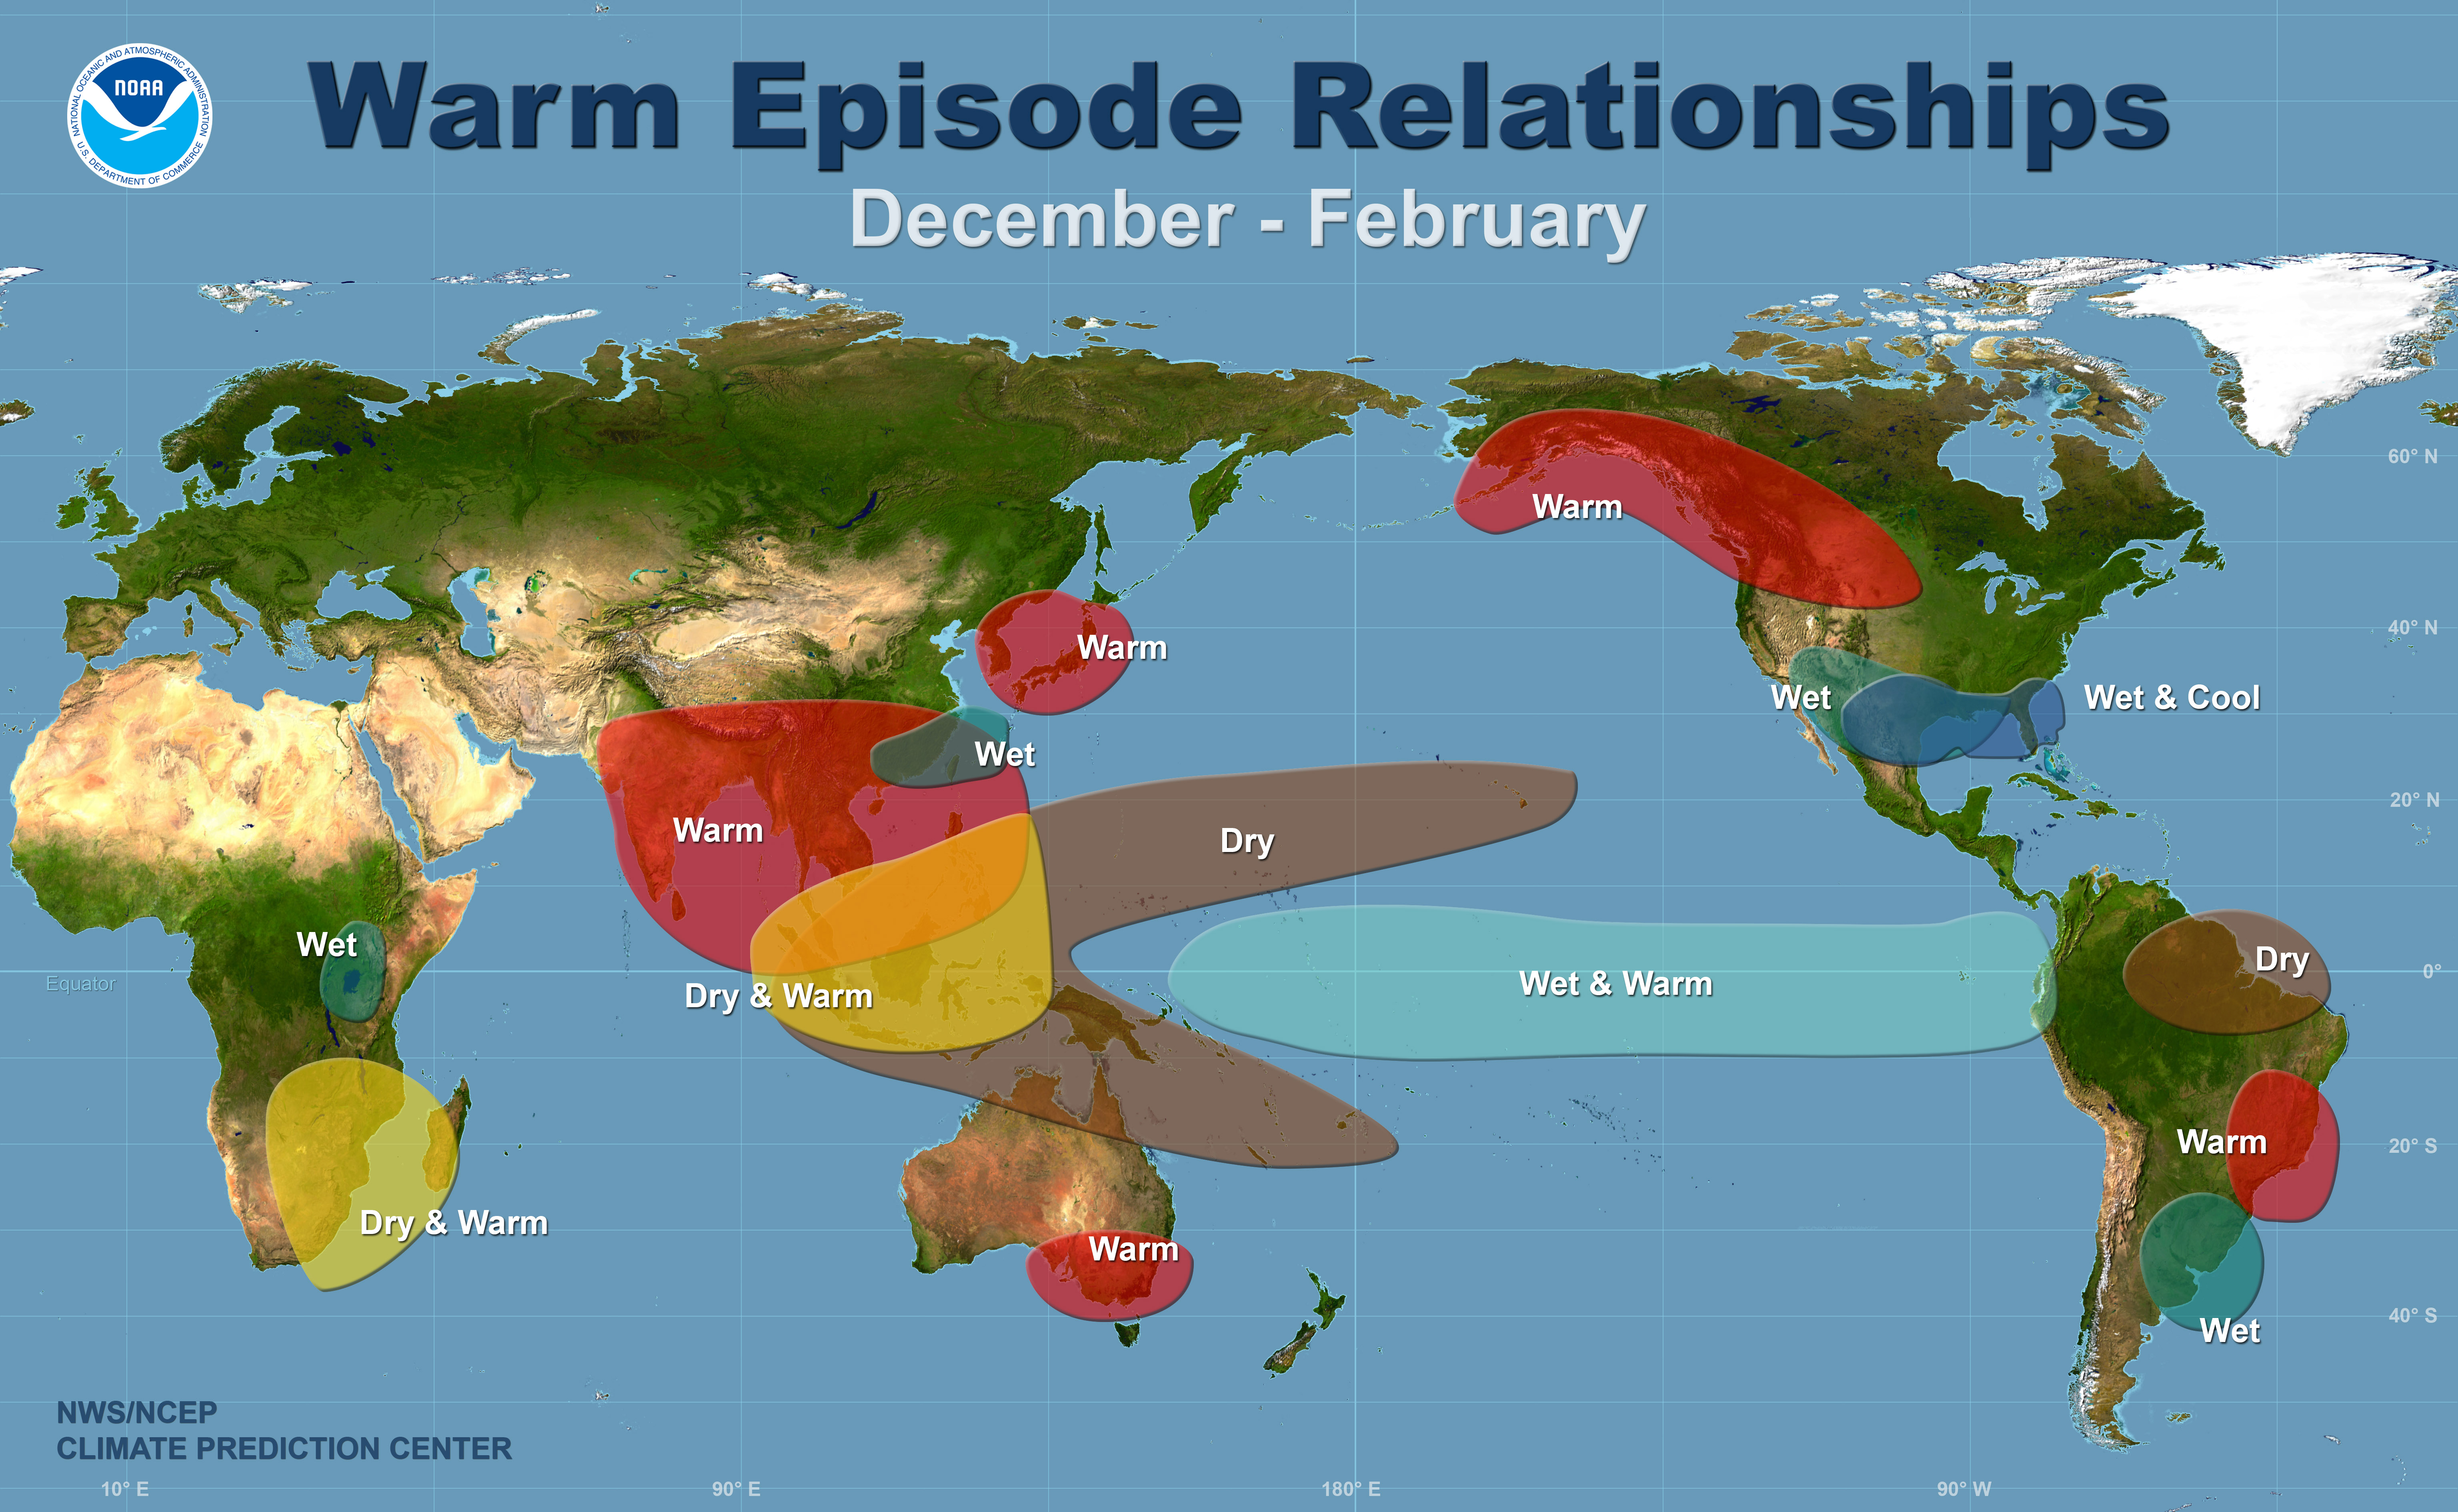
Figure 2. The typical shifts from normal climatic condition during the Northern Hemisphere winter (December - February) during El Niño episode. Image credit: NOAA/Climate Prediction Center.
An intense hurricane/typhoon season in the Pacific, and quiet in the Atlantic
The unusually warm waters that El Niño brings to the North Pacific usually leads to well above-average hurricane and typhoon activity in that ocean basin, with unusually intense storms. The strongest Eastern Pacific hurricane ever recorded prior to 2015, Category 5 Hurricane Linda, occurred during the strong El Niño year of 1997. Linda had sustained winds up to 185 mph and a central pressure of 902 mb on September 12th. The El Niño year of 1997 also saw a record number of Category 5 storms in the Northwest Pacific—ten, and a record ACE index of 594. At one point on October 17, 1997, Super Typhoon Joan had top sustained winds of 185 mph, while Super Typhoon Ivan had top winds of 180 mph--the first time that Category 5 storms of such extreme intensity existed simultaneously. Typhoons tend to form farther to the east in an El Niño episode, due to the warmer waters over the Central Pacific. Thus, El Niño-year typhoons take longer tracks over water before hitting Asia, resulting in a greater chance of reaching Category 5 intensity.
True to expectations, the strong El Niño event of 2015 has led to record-smashing activity for hurricanes and typhoons in the North Pacific. The all-time most intense Eastern Pacific hurricane on record is now 2015’s Hurricane Patricia, which attained a remarkable 879 mb pressure with sustained winds of 200 mph. It's also been a record-active Central Pacific hurricane season in 2015, and a much more active than usual Western Pacific typhoon season. The Accumulated Cyclone Energy (ACE) for the Western Pacific was 161% of average as of November 13, and was 200% of average for the combined Eastern and Central Pacific Oceans. However, it’s a different story in the Atlantic, where El Niño has brought dry air and strong upper level westerly winds, creating high wind shear, suppressing Atlantic hurricanes. The ACE in the Atlantic this year has been only 57% of average.

Figure 3. Category 5 Hurricane Linda, the strongest hurricane on record in the Eastern Pacific prior to 2015, had sustained winds of 185 mph and a central pressure of 902 mb on September 12, 1997.
Flooding in South America
El Niño refers to the (Christ) Child in the Spanish language, and got its name from Peruvian sailors, who noted the arrival of warm waters off the coast of Peru typically coincided with Christmas. And it is in Peru and surrounding countries where the impact of El Niño on the weather can be the most severe. The unusually warm waters commonly cause record-breaking rains along the Pacific coast of equatorial South America, since warm air holds much more water vapor.
The two deadliest floods in Ecuador's history occurred during strong El Niño events: in November 1982 (307 killed) and during October 1997 (218 killed.) Peru’s deadliest flood (518 killed) also occurred during the 1997 El Niño. As reported by AP, a United Nations-backed study said that the 1997 - 1998 El Niño cost Bolivia, Colombia, Ecuador, Peru and Venezuela nearly $11 billion.
Peru declared a pre-emptive state of emergency in July 2015 for 14 of its 25 states, appropriating about $70 million to prepare for the coming fall and winter rains. Authorities are clearing river beds of debris, reinforcing river banks with rocks and sandbags, and fortifying reservoir walls.

Figure 4. Residents of of Naranjal, Ecuador, walk along one of the town's flooded streets on November 28, 1997, after El Niño-driven floods killed at least 41 people along Ecuador's coast. Photo credit: ALICIA SMITH/AFP/Getty Images.
El Niño and drought
The warm waters off the Pacific coast of Peru during a strong El Niño episode generate a column of rising air over the tropical Eastern Pacific. Once this rising air reaches the bottom of the stratosphere, which acts as a stable lid preventing further rising motion, the warm air is forced to spread out to the east and west along the Equator. This air eventually sinks over tropical regions well to the east and the west of the Eastern Pacific to complete a huge circulation cell several thousand miles in diameter. Since sinking air warms and dries as it descends, areas of high pressure and drought tend to form in these sinking air regions. To the west of the Eastern Pacific, El Niño events tend to create drought over Indonesia, New Guinea, and Northern Australia; to the east, drought commonly occurs over Central America, Northern Brazil and the Caribbean.

Figure 5. Greenhouse gas emissions from Indonesian forest fires have exceeded all emissions from the U.S. economy on most days in September and October 2015. Image credit: World Resources Institute.
Drought in Indonesia
As discussed in detail in the Jeff Masters October 13 post, Costliest (and Deadliest?) Disaster of 2015: Indonesia's $14 Billion Fires, the El Niño events of 2015 and 1997 - 1998 brought devastating drought and fires to Indonesia and neighboring countries. This year's fires in Indonesia are on track to be their most expensive disaster in history, beating the $9.3 billion price tag of the 1997 - 1998 fires.
Drought in Australia
Drought in parts of southern and northern Australia typical for El Niño has already begun in 2015, and may cut as much as 1 percent off of the country's GDP, said Andrew Watkins, supervisor of climate prediction services at the Australian Bureau of Meteorology, in an AP interview. October 2015 was Australia’s hottest month ever recorded, and rainfall was below average over most of the country. Two of the three most expensive droughts in Australia’s history occurred during the moderate El Niño years of 2002 and 1992.
Drought in Central America, the Caribbean and Brazil
The atmospheric circulation associated with El Niño brings dry air and high pressure to northern Brazil, the Caribbean, Central America and the tropical Atlantic; these conditions tend to bring drought. According to the U.N.’s Food and Agriculture Organization, dry weather caused by El Niño through September 2015 was responsible for declines of 60 percent in maize and 80 percent in beans across the Central American countries of El Salvador, Guatemala, Honduras and Nicaragua (thanks go to Natasha Geiling of Climate Progress for this link.) Severe drought is also impacting eastern Puerto Rico, according to the latest U.S. Drought Monitor report. As of November 12, San Juan was 13” below their average precipitation of 47” for the year-to-date period. Water rationing was imposed for several hundred thousand residents over the summer, but was eased in mid-September. On St. Barthelemy in the Lesser Antilles Islands, rainfall from January - September 2015 was only 8.65"--way short of their usual 23.74" (thanks go to wunderground member zicoille for this link.) The latest Global Drought Monitor shows areas of drought were also occurring over Northern Brazil this year, though this drought was not widespread. Only one of the top five most expensive droughts in Brazil’s history (2014, 1978, 2004, 2012, and 1985) occurred during an El Niño year—2004, during a weak El Niño.
Failure of the monsoon in India
The atmospheric circulation patterns brought on by an El Niño event usually cause much reduced monsoon rains in India. According to EM-DAT, the International Disaster Database, more than 4.2 million people died in India between 1900 - 2014 due to droughts from failed monsoon rains, primarily during El Niño years. Up until the late 1960s, it was common for the failure of the monsoon rains to kill millions of people in India; the 3-year drought that began during the strong El Niño event of 1965 killed at least 1.5 million people. However, since the Green Revolution of the late 1960s--a government initiative to improve food self-sufficiency using new technology and high-yield grains--failure of the monsoon rains has not led to mass famine in India.
As of October 1, 2015, this year's monsoon had brought rains 14% below normal to India, in line with pre-season predictions of a deficient monsoon. This would not rank as one of the top five worst Indian monsoons for rainfall deficit, though. Here are the top five worst years for rainfall deficit in India, which all occurred during El Niño conditions:
1) 1877, -33% (strong El Niño)
2) 1899, -29% (weak El Niño)
3) 1918, -25% (weak El Niño)
4) 1972, -24% (strong El Niño)
5) 2009, -22% (weak El Niño)
Drought in Africa
El Niño typically bring deficient rains across Southern Africa during their rainy season, which normally starts in October and lasts through March. According to an October 1 report from Oxfam, during the 2014 - 2015 rainy season, the rains came more than a month late, then became extraordinarily heavy in mid-December through January, causing extensive flooding and crop damage. The combination of drought and flooding in early 2015 have caused Malawi, Zimbabwe, and Mozambique to have major food security issues heading into the coming El Niño rainy season.

Figure 6. Monthly precipitation departure from the long-term average during October 2015. Map by climate.gov, data from the CPC ARC2. Image credit: NOAA El Niño blog.
North America: cool and wet in the south, warm in the north
Bob Henson's July 2015 post, What to Expect from El Niño: North America, discussed in great detail the usual impacts El Niño has on the winter weather in North America. These include potential drought-easing rains for California; milder and drier weather in the Pacific Northwest, Northern Plains, and western Canada; below-average snowfall in the Northern Rockies and above average in the Southern Rockies; and rainy and cool across the Gulf Coast. The impacts on the Northeast U.S. are more complicated, as he discussed in his follow-up post, What to Expect from El Niño: How Much Snow Back East? His post from last Friday, Will El Niño Bring a December Warm Wave to North America? has the latest on what to expect in North America from El Niño.
See our new El Niño micro-site for full details on the current status and forecast for El Niño.
Video 1. Chris Farley of Saturday Night Live explains everything you need to know about El Niño.
Our next post will be Wednesday at the latest.
Jeff Masters
Figure 1. Sea-surface temperatures (SSTs) in the Pacific’s Niño3.4 region, between 90°W and 160°E longitude and 5° north/south latitude, are considered the benchmark for rating the strength of an El Niño event. The weekly departure of SST from average in this region hit +3.0°C (5.4°F) over the past week, beating the previous record of +2.8°C set during November 1997 during that year's super-El Niño. Image credit: Jan Null Golden Gate Weather, via Twitter.
Figure 2. The typical shifts from normal climatic condition during the Northern Hemisphere winter (December - February) during El Niño episode. Image credit: NOAA/Climate Prediction Center.
An intense hurricane/typhoon season in the Pacific, and quiet in the Atlantic
The unusually warm waters that El Niño brings to the North Pacific usually leads to well above-average hurricane and typhoon activity in that ocean basin, with unusually intense storms. The strongest Eastern Pacific hurricane ever recorded prior to 2015, Category 5 Hurricane Linda, occurred during the strong El Niño year of 1997. Linda had sustained winds up to 185 mph and a central pressure of 902 mb on September 12th. The El Niño year of 1997 also saw a record number of Category 5 storms in the Northwest Pacific—ten, and a record ACE index of 594. At one point on October 17, 1997, Super Typhoon Joan had top sustained winds of 185 mph, while Super Typhoon Ivan had top winds of 180 mph--the first time that Category 5 storms of such extreme intensity existed simultaneously. Typhoons tend to form farther to the east in an El Niño episode, due to the warmer waters over the Central Pacific. Thus, El Niño-year typhoons take longer tracks over water before hitting Asia, resulting in a greater chance of reaching Category 5 intensity.
True to expectations, the strong El Niño event of 2015 has led to record-smashing activity for hurricanes and typhoons in the North Pacific. The all-time most intense Eastern Pacific hurricane on record is now 2015’s Hurricane Patricia, which attained a remarkable 879 mb pressure with sustained winds of 200 mph. It's also been a record-active Central Pacific hurricane season in 2015, and a much more active than usual Western Pacific typhoon season. The Accumulated Cyclone Energy (ACE) for the Western Pacific was 161% of average as of November 13, and was 200% of average for the combined Eastern and Central Pacific Oceans. However, it’s a different story in the Atlantic, where El Niño has brought dry air and strong upper level westerly winds, creating high wind shear, suppressing Atlantic hurricanes. The ACE in the Atlantic this year has been only 57% of average.
Figure 3. Category 5 Hurricane Linda, the strongest hurricane on record in the Eastern Pacific prior to 2015, had sustained winds of 185 mph and a central pressure of 902 mb on September 12, 1997.
Flooding in South America
El Niño refers to the (Christ) Child in the Spanish language, and got its name from Peruvian sailors, who noted the arrival of warm waters off the coast of Peru typically coincided with Christmas. And it is in Peru and surrounding countries where the impact of El Niño on the weather can be the most severe. The unusually warm waters commonly cause record-breaking rains along the Pacific coast of equatorial South America, since warm air holds much more water vapor.
The two deadliest floods in Ecuador's history occurred during strong El Niño events: in November 1982 (307 killed) and during October 1997 (218 killed.) Peru’s deadliest flood (518 killed) also occurred during the 1997 El Niño. As reported by AP, a United Nations-backed study said that the 1997 - 1998 El Niño cost Bolivia, Colombia, Ecuador, Peru and Venezuela nearly $11 billion.
Peru declared a pre-emptive state of emergency in July 2015 for 14 of its 25 states, appropriating about $70 million to prepare for the coming fall and winter rains. Authorities are clearing river beds of debris, reinforcing river banks with rocks and sandbags, and fortifying reservoir walls.
Figure 4. Residents of of Naranjal, Ecuador, walk along one of the town's flooded streets on November 28, 1997, after El Niño-driven floods killed at least 41 people along Ecuador's coast. Photo credit: ALICIA SMITH/AFP/Getty Images.
El Niño and drought
The warm waters off the Pacific coast of Peru during a strong El Niño episode generate a column of rising air over the tropical Eastern Pacific. Once this rising air reaches the bottom of the stratosphere, which acts as a stable lid preventing further rising motion, the warm air is forced to spread out to the east and west along the Equator. This air eventually sinks over tropical regions well to the east and the west of the Eastern Pacific to complete a huge circulation cell several thousand miles in diameter. Since sinking air warms and dries as it descends, areas of high pressure and drought tend to form in these sinking air regions. To the west of the Eastern Pacific, El Niño events tend to create drought over Indonesia, New Guinea, and Northern Australia; to the east, drought commonly occurs over Central America, Northern Brazil and the Caribbean.
Figure 5. Greenhouse gas emissions from Indonesian forest fires have exceeded all emissions from the U.S. economy on most days in September and October 2015. Image credit: World Resources Institute.
Drought in Indonesia
As discussed in detail in the Jeff Masters October 13 post, Costliest (and Deadliest?) Disaster of 2015: Indonesia's $14 Billion Fires, the El Niño events of 2015 and 1997 - 1998 brought devastating drought and fires to Indonesia and neighboring countries. This year's fires in Indonesia are on track to be their most expensive disaster in history, beating the $9.3 billion price tag of the 1997 - 1998 fires.
Drought in Australia
Drought in parts of southern and northern Australia typical for El Niño has already begun in 2015, and may cut as much as 1 percent off of the country's GDP, said Andrew Watkins, supervisor of climate prediction services at the Australian Bureau of Meteorology, in an AP interview. October 2015 was Australia’s hottest month ever recorded, and rainfall was below average over most of the country. Two of the three most expensive droughts in Australia’s history occurred during the moderate El Niño years of 2002 and 1992.
Drought in Central America, the Caribbean and Brazil
The atmospheric circulation associated with El Niño brings dry air and high pressure to northern Brazil, the Caribbean, Central America and the tropical Atlantic; these conditions tend to bring drought. According to the U.N.’s Food and Agriculture Organization, dry weather caused by El Niño through September 2015 was responsible for declines of 60 percent in maize and 80 percent in beans across the Central American countries of El Salvador, Guatemala, Honduras and Nicaragua (thanks go to Natasha Geiling of Climate Progress for this link.) Severe drought is also impacting eastern Puerto Rico, according to the latest U.S. Drought Monitor report. As of November 12, San Juan was 13” below their average precipitation of 47” for the year-to-date period. Water rationing was imposed for several hundred thousand residents over the summer, but was eased in mid-September. On St. Barthelemy in the Lesser Antilles Islands, rainfall from January - September 2015 was only 8.65"--way short of their usual 23.74" (thanks go to wunderground member zicoille for this link.) The latest Global Drought Monitor shows areas of drought were also occurring over Northern Brazil this year, though this drought was not widespread. Only one of the top five most expensive droughts in Brazil’s history (2014, 1978, 2004, 2012, and 1985) occurred during an El Niño year—2004, during a weak El Niño.
Failure of the monsoon in India
The atmospheric circulation patterns brought on by an El Niño event usually cause much reduced monsoon rains in India. According to EM-DAT, the International Disaster Database, more than 4.2 million people died in India between 1900 - 2014 due to droughts from failed monsoon rains, primarily during El Niño years. Up until the late 1960s, it was common for the failure of the monsoon rains to kill millions of people in India; the 3-year drought that began during the strong El Niño event of 1965 killed at least 1.5 million people. However, since the Green Revolution of the late 1960s--a government initiative to improve food self-sufficiency using new technology and high-yield grains--failure of the monsoon rains has not led to mass famine in India.
As of October 1, 2015, this year's monsoon had brought rains 14% below normal to India, in line with pre-season predictions of a deficient monsoon. This would not rank as one of the top five worst Indian monsoons for rainfall deficit, though. Here are the top five worst years for rainfall deficit in India, which all occurred during El Niño conditions:
1) 1877, -33% (strong El Niño)
2) 1899, -29% (weak El Niño)
3) 1918, -25% (weak El Niño)
4) 1972, -24% (strong El Niño)
5) 2009, -22% (weak El Niño)
Drought in Africa
El Niño typically bring deficient rains across Southern Africa during their rainy season, which normally starts in October and lasts through March. According to an October 1 report from Oxfam, during the 2014 - 2015 rainy season, the rains came more than a month late, then became extraordinarily heavy in mid-December through January, causing extensive flooding and crop damage. The combination of drought and flooding in early 2015 have caused Malawi, Zimbabwe, and Mozambique to have major food security issues heading into the coming El Niño rainy season.
Figure 6. Monthly precipitation departure from the long-term average during October 2015. Map by climate.gov, data from the CPC ARC2. Image credit: NOAA El Niño blog.
North America: cool and wet in the south, warm in the north
Bob Henson's July 2015 post, What to Expect from El Niño: North America, discussed in great detail the usual impacts El Niño has on the winter weather in North America. These include potential drought-easing rains for California; milder and drier weather in the Pacific Northwest, Northern Plains, and western Canada; below-average snowfall in the Northern Rockies and above average in the Southern Rockies; and rainy and cool across the Gulf Coast. The impacts on the Northeast U.S. are more complicated, as he discussed in his follow-up post, What to Expect from El Niño: How Much Snow Back East? His post from last Friday, Will El Niño Bring a December Warm Wave to North America? has the latest on what to expect in North America from El Niño.
See our new El Niño micro-site for full details on the current status and forecast for El Niño.
Video 1. Chris Farley of Saturday Night Live explains everything you need to know about El Niño.
Our next post will be Wednesday at the latest.
Jeff Masters
The views of the author are his/her own and do not necessarily represent the position of The Weather Company or its parent, IBM.