WunderBlog Archive » Category 6™
Category 6 has moved! See the latest from Dr. Jeff Masters and Bob Henson here.Earth Rings in 2016 With its Warmest January on Record
After recording its warmest year on record in 2015, Earth continued its record-warm streak into 2016, with January 2016 being the planet's warmest January since record keeping began in 1880, said NOAA's National Centers for Environmental Information (NCEI) on Wednesday. The month had the second warmest departure from average (+1.04°C) of any month since 1880, with only December 2015 being warmer. NASA also rated January 2016 as the warmest January on record, but said it edged out December 2015 for being the warmest month in the entire historical record--1.13°C above average. The four warmest months since 1880 (as measured by departure from average in the NASA database) were the past four months. Here are the top five warmest months in the historical record, according to NASA:
1) January 2016
2) December 2015
3) October 2015
4) November 2015
5) January 2007
January 2016 also marked the ninth consecutive month that the monthly temperature record was been broken and the fourteenth consecutive month (since December 2014) that the monthly global temperature ranked among the three warmest for its respective month in the NOAA database. Global ocean temperatures during January 2016 were the warmest on record, and global land temperatures were the second warmest on record. Global satellite-measured temperatures in January 2016 for the lowest 8 km of the atmosphere were the warmest in the 38-year record, according to the University of Alabama Huntsville (UAH). This is the fourth consecutive month the UAH database has registered a record monthly high.

Figure 1. Departure of temperature from average for January 2016, the warmest January for the globe since record keeping began in 1880. Record warmth was observed across a swath of northern Siberia where temperatures rose at least 5°C (9°F) above the 1981–2010 monthly average, as well as across parts of southeastern Asia, southwestern Asia and the Middle East, most of southern Africa, and areas of Central and South America. Record warmth was observed in all major ocean basins: various regions of the eastern and western Atlantic, particularly near coasts, part of the Barents Sea in the Arctic; the Southeast Indian Ocean to the south of Australia; most of the North Indian Ocean; parts of the eastern and central equatorial Pacific; and the western Mediterranean Sea. Image credit: National Centers for Environmental Information (NCEI).
Two billion-dollar weather disasters in January 2016
Two billion-dollar weather-related disasters hit the Earth during last month, according to the January 2016 Catastrophe Report from insurance broker Aon Benfield. Both were due to winter weather: Winter Storm Jonas in the Eastern U.S., and a remarkable cold wave in Eastern Asia. Both disasters cost at least $2 billion.

Disaster 1. A massive blizzard rocked the Mid-Atlantic and Northeast U.S. January 22 - 24, killing 58 and causing at least $2 billion in damage. The snowstorm was rated the 4th most severe to hit the area in the past 66 years, according to NOAA. In this image, we see residents being forced to walk in the streets of Washington, D.C. during the storm. Image credit: Joe Flood, NOAA.

Disaster 2. One of the most intense cold air outbreaks in decades brought record low temperatures and heavy snowfall throughout much of East Asia January 20 - 25, killing a combined 116 people in Taiwan, Thailand, China, Japan and South Korea. China reported more than $1.6 billion in damage from cold and snow, and Taiwan’s agricultural sector recorded its highest losses in 17 years. Total damage from the winter weather was estimated at $2 billion. In this image, we see row boats stuck in the ice of the frozen coastal waters of Jiaozhou Bay in Qingdao in eastern China's Shandong province on January 25, 2016. Image credit: STR/AFP/Getty Images.
Strong El Niño gradually weakening
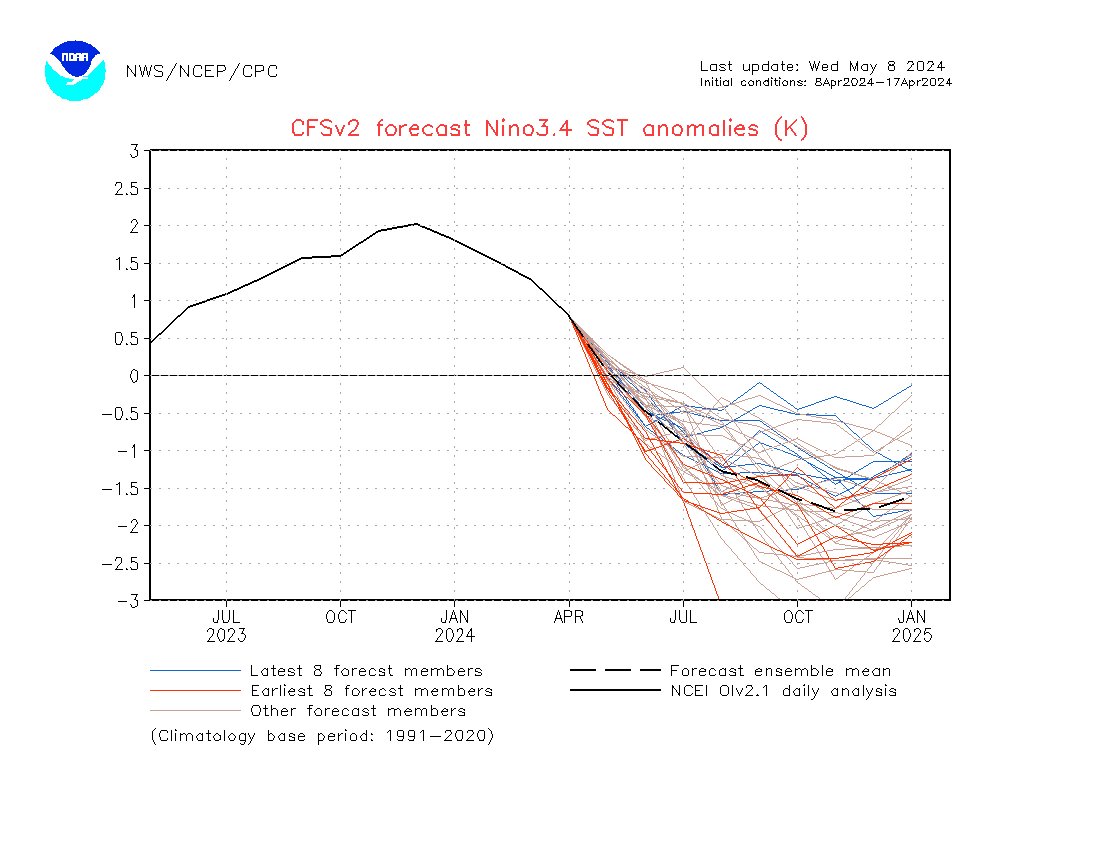
January 2016 featured strong El Niño conditions in the equatorial Eastern Pacific, with sea surface temperatures (SSTs) ending up 2.5°C above average in the so-called Niño3.4 region (5°S - 5°N, 120°W - 170°W), where SSTs must be at least 0.5°C above average for five consecutive months (each month being a 3-month average) for an El Niño event to be declared. El Niño peaked in strength in late November 2015, when the weekly Niño3.4 temperature anomaly hit a record 3.1°C. The anomaly was still a hefty +2.5°C this week, and El Niño is not weakening as quickly as many forecasts have predicted. NOAA still expects a transition to neutral conditions during late Northern Hemisphere spring or early summer 2016, though, with a possible transition to La Niña conditions during the fall. Many of the El Niño computer models are predicting La Niña conditions during the August-September-October peak of hurricane season, which could lead to an active Atlantic hurricane season (NOAA"s CFSv2 model is a noteworthy exception, with the latest ensemble average from Feb. 15 suggesting that weak El Niño conditions might hang on through at least autumn 2016.) Even though NOAA has not issued an official "La Nina Watch", the probability is trending towards one, said NOAA El Niño expert Michelle L'Heureux, in an interview with Reuters last week. El Niño model predictions are least likely to be accurate when issued during the period from February to May, though, which is called the "Predictability Barrier" for forecasting El Niño.
Arctic sea ice falls to lowest January extent on record
Arctic sea ice extent during January 2016 was the lowest in the 38-year satellite record, according to the National Snow and Ice Data Center (NSIDC). Air temperatures just above the surface, at the 925 mb level, were more than 6 degrees Celsius (13 degrees Fahrenheit) above average across most of the Arctic Ocean. These unusually high air temperatures were likely related to the behavior of the Arctic Oscillation (AO.) While the AO was in a positive phase for most of the autumn and early winter, it turned strongly negative beginning in January. By mid-January, the index reached nearly -5 sigma (five standard deviations) below average. The AO then shifted back to positive during the last week of January.
Notable global heat and cold marks set for January 2016
Hottest temperature in the Northern Hemisphere: 43.0°C (109.4°F) at Linguere , Senegal, January 13
Coldest temperature in the Northern Hemisphere: -55.3°C (-67.5°F) at Summit, Greenland, January 31
Hottest temperature in the Southern Hemisphere: 48.6°C (119.5°F) at Augrabies Falls, South Africa, January 5
Coldest temperature in the Southern Hemisphere: -46.3°C (-51.3°F) at Dome Fuji, Antarctica, January 28
(Courtesy of Maximiliano Herrera.)
Major weather stations that set (not tied) new all-time heat or cold records in January 2016
Sutherland (South Africa) max. 37.9°C, 4 January
Kimberley (South Africa) max. 43.3°C, 5 January
Prieska (South Africa) max. 44.7°C, 5 January
Fraserburg (South Africa) max. 41.2°C, 5 January
De Aar (South Africa) max. 42.8°C, 5 January
Upington (South Africa) max. 45.3°C, 5 January
Vanwyksvlei (South Africa) max. 43.9°C, 5 January
Queenstown (South Africa) max. 42.9°C, 5 January
Pofadder (South Africa) max. 42.4°C, 5 January
Buffelsfontein (South Africa) max. 38.6°C, 5 January
Jamestown (South Africa) max. 38.7°C, 5 January
Cradock (South Africa) max. 43.8°C, 5 January
Van Zylsrus (South Africa) max. 45.4°C, 6 January
Kuruman (South Africa) max. 44.3°C, 6 January
Bloemhof (South Africa) max. 43.7°C, 6 January
Bloemfontein Airport (South Africa) max. 42.0°C, 6 January
Bloemfontein City (South Africa) max. 41.4°C, 6 January
Glen College (South Africa) max. 43.2°C, 6 January
Twee Riviere (South Africa) max. 45.4°C, 6 January
Welkom (South Africa) max. 41.4°C, 6 January
Ottosdal (South Africa) max. 42.4°C, 6 January
Estcourt (South Africa) max. 41.7°C, 6 January
Vryburg (South Africa) max. 43.7°C, 6 January
Ladysmith (South Africa) max. 43.0°C, 6 January
Taung (South Africa) max. 44.6°C, 6 January
Bethlehem (South Africa) max. 37.4°C, 6 January
Kroonstad (South Africa) max. 41.0°C, 6 January
Bothaville (South Africa) max. 41.8°C, 6 January
Royal National Park (South Africa) max. 39.7°C, 6 January
Werda (Botswana) max. 43.3°C, 6 January
Tsabong (Botswana) max. 43.5°C, 6 January: New national record high for Botswana
Maun (Botswana) max. 43.8°C, 7 January: New national record high for Botswana
Gaborone (Botswana) max. 42.7°C, 7 January
Jwaneng (Botswana) max. 41.9°C, 7 January
Pretoria City (South Africa) max. 42.7°C, 7 January
Pretoria Airport (South Africa) max. 38.7°C, 7 January
Johannesburg (South Africa) max. 38.9°C, 7 January
Johannesburg Aiport (South Africa) max. 35.9°C, 7 January
Frankfort (South Africa) max. 40.4°C, 7 January
Rustenburg (South Africa) max. 41.6°C, 7 January
Oudestad (South Africa) max. 42.5°C, 7 January
Ellisras (South Africa) max. 44.5°C, 7 January
Thabazimbi (South Africa) max. 44.7°C, 7 January
Warmbaths Towoomba (South Africa) max. 43.7°C, 7 January
Marico (South Africa) max. 45.0°C, 7 January
Buffelspoort (South Africa) max. 42.4°C, 7 January
Mara (South Africa) max. 42.4, 7 January
Bulawayo Airport (Zimbabwe) max. 39.3°C, 7 January
Gweru (Zimbabwe) max. 37.0°C, 7 January
Binga (Zimbabwe) max. 42.4°C, 8 January
Futuna Aiport (Wallis and Futuna, France) max. 35.8°C, 10 January: New territorial record high for Wallis and Futuna
Ambon (Indonesia) max. 36.0°C, 22 January
Xiamen (China) min. 0.1°C, 24 January
Fuzhou (China) min. -1.9°C, 24 January
Dachen Dao (China) min. -4.1°C, 24 January
Dongsha Dao (China) min. 12.6°C, 24 January
Tai Mo Shan (Hong Kong, China) min. -5.7°C, 24 January: New Territorial record low for Hong Kong
Su' ao (Taiwan) min. 5.0°C, 24 January
Xinwu (Taiwan) min. 4.2°C, 24 January
Anbu (Taiwan) min. -3.7°C, 24 January
Zhuzihu (Taiwan) min. -1.5°C, 24 January
Kinmen (Taiwan) min. 1.3°C, 24 January
Matsu (Taiwan) min. 0.3°C, 24 January
Onoaida (Japan) min. 0.6°C, 24 January
Okinoerabu (Japan) min. 4.7°C, 24 January
Hitoyoshi (Japan) min. -9.8°C, 25 January
Okuchi (Japan) min. -15.2°C, 25 January
Ue (Japan) min. -13.8°C, 25 January
Kakutou (Japan) min. -12.0°C, 25 January
Satsuma-Kashiwabaru (Japan) min. -10.8°C, 25 January
Tashiro (Japan) min. -10.4°C, 25 January
Shiroishi (Japan) min. -9.6°C, 25 January
Tokashiki (Japan) min. 3.7°C, 25 January
Itokazu (Japan) min. 4.1°C, 25 January
Izena (Japan) min. 5.2°C, 25 January
Ibaruma (Japan) min. 7.6°C, 25 January
Sibolga (Indonesia) max. 37.1°C, 27 January
(Courtesy of Maximiliano Herrera.)
Three all-time national heat records and one all-time cold record set through mid-February 2016
Just over one month into the year, three nations or territories have tied or set all-time records for their hottest temperature in recorded history in 2016, and one (Hong Kong) has set an all-time cold temperature record. Most nations do not maintain official databases of extreme temperature records, so the national temperature records reported here are in many cases not official. I use as my source for international weather records researcher Maximiliano Herrera, one of the world's top climatologists, who maintains a comprehensive list of extreme temperature records for every nation in the world on his website. If you reproduce this list of extremes, please cite Maximiliano Herrera as the primary source of the weather records. Wunderground's weather historian Christopher C. Burt maintains a database of these national heat and cold records for 235 nations and territories on wunderground.com's extremes page. Here are 2016's all-time heat and cold records so far:
Botswana set its all-time hottest record on January 7, 2016, when the mercury hit 43.8°C (110.8°F) at Maun. The old record was set just the previous day (January 6, 2016) with 43.5°C (110.3°F) at Tsabong. The record heat in Botswana during the first week of January was part of a remarkable heat wave that affected much of southern Africa, causing at least $250 million in drought-related damages to South Africa in January. Mr. Herrera noted in an email to me that temperatures in South Africa at elevations between 1000 and 1600 meters were higher than any previous temperatures ever recorded at those altitudes anywhere in the world. The national heat records of Lesotho, Mozambique, Namibia, and Swaziland might all have fallen were it not for the lack of observing stations in the hottest areas. Lesotho has no weather stations that issue the standard "synoptic" weather observations every six hours anymore; Mozambique and Swaziland have closed all their stations in the hottest areas; and Namibia just closed its Noordower station, which was its hottest station.
Wallis and Futuna Territory (France) set a new territorial heat record with 35.8°C (96.4°F) on January 10, 2016 at Futuna Airport. This is the second year in a row that Wallis and Futuna has beaten its all-time heat mark; the previous record was a 35.5°C (95.9°F) reading on January 19, 2015 at the Futuna Airport.
Vanuatu in the South Pacific set its all-time national heat record on February 8, 2016, when the mercury hit 36.2°C (97.2°F) at Lamap Malekula. The previous record was a 35.7°C (96.3°F) reading just the previous day (February 7, 2016) at the Bauerfield Efate Airport. All seven major weather reporting stations in Vanuatu beat or tied their all-time heat records February 7 - 8, 2016.
Hong Kong Territory (China) set its all-time coldest mark on January 24, 2016, when the mercury dipped to -5.7°C (21.7°F) at Tai Mo Shan.
We'll have a new post on Friday.
Jeff Masters
1) January 2016
2) December 2015
3) October 2015
4) November 2015
5) January 2007
January 2016 also marked the ninth consecutive month that the monthly temperature record was been broken and the fourteenth consecutive month (since December 2014) that the monthly global temperature ranked among the three warmest for its respective month in the NOAA database. Global ocean temperatures during January 2016 were the warmest on record, and global land temperatures were the second warmest on record. Global satellite-measured temperatures in January 2016 for the lowest 8 km of the atmosphere were the warmest in the 38-year record, according to the University of Alabama Huntsville (UAH). This is the fourth consecutive month the UAH database has registered a record monthly high.
Figure 1. Departure of temperature from average for January 2016, the warmest January for the globe since record keeping began in 1880. Record warmth was observed across a swath of northern Siberia where temperatures rose at least 5°C (9°F) above the 1981–2010 monthly average, as well as across parts of southeastern Asia, southwestern Asia and the Middle East, most of southern Africa, and areas of Central and South America. Record warmth was observed in all major ocean basins: various regions of the eastern and western Atlantic, particularly near coasts, part of the Barents Sea in the Arctic; the Southeast Indian Ocean to the south of Australia; most of the North Indian Ocean; parts of the eastern and central equatorial Pacific; and the western Mediterranean Sea. Image credit: National Centers for Environmental Information (NCEI).
Two billion-dollar weather disasters in January 2016
Two billion-dollar weather-related disasters hit the Earth during last month, according to the January 2016 Catastrophe Report from insurance broker Aon Benfield. Both were due to winter weather: Winter Storm Jonas in the Eastern U.S., and a remarkable cold wave in Eastern Asia. Both disasters cost at least $2 billion.
Disaster 1. A massive blizzard rocked the Mid-Atlantic and Northeast U.S. January 22 - 24, killing 58 and causing at least $2 billion in damage. The snowstorm was rated the 4th most severe to hit the area in the past 66 years, according to NOAA. In this image, we see residents being forced to walk in the streets of Washington, D.C. during the storm. Image credit: Joe Flood, NOAA.
Disaster 2. One of the most intense cold air outbreaks in decades brought record low temperatures and heavy snowfall throughout much of East Asia January 20 - 25, killing a combined 116 people in Taiwan, Thailand, China, Japan and South Korea. China reported more than $1.6 billion in damage from cold and snow, and Taiwan’s agricultural sector recorded its highest losses in 17 years. Total damage from the winter weather was estimated at $2 billion. In this image, we see row boats stuck in the ice of the frozen coastal waters of Jiaozhou Bay in Qingdao in eastern China's Shandong province on January 25, 2016. Image credit: STR/AFP/Getty Images.
Strong El Niño gradually weakening
January 2016 featured strong El Niño conditions in the equatorial Eastern Pacific, with sea surface temperatures (SSTs) ending up 2.5°C above average in the so-called Niño3.4 region (5°S - 5°N, 120°W - 170°W), where SSTs must be at least 0.5°C above average for five consecutive months (each month being a 3-month average) for an El Niño event to be declared. El Niño peaked in strength in late November 2015, when the weekly Niño3.4 temperature anomaly hit a record 3.1°C. The anomaly was still a hefty +2.5°C this week, and El Niño is not weakening as quickly as many forecasts have predicted. NOAA still expects a transition to neutral conditions during late Northern Hemisphere spring or early summer 2016, though, with a possible transition to La Niña conditions during the fall. Many of the El Niño computer models are predicting La Niña conditions during the August-September-October peak of hurricane season, which could lead to an active Atlantic hurricane season (NOAA"s CFSv2 model is a noteworthy exception, with the latest ensemble average from Feb. 15 suggesting that weak El Niño conditions might hang on through at least autumn 2016.) Even though NOAA has not issued an official "La Nina Watch", the probability is trending towards one, said NOAA El Niño expert Michelle L'Heureux, in an interview with Reuters last week. El Niño model predictions are least likely to be accurate when issued during the period from February to May, though, which is called the "Predictability Barrier" for forecasting El Niño.
Arctic sea ice falls to lowest January extent on record
Arctic sea ice extent during January 2016 was the lowest in the 38-year satellite record, according to the National Snow and Ice Data Center (NSIDC). Air temperatures just above the surface, at the 925 mb level, were more than 6 degrees Celsius (13 degrees Fahrenheit) above average across most of the Arctic Ocean. These unusually high air temperatures were likely related to the behavior of the Arctic Oscillation (AO.) While the AO was in a positive phase for most of the autumn and early winter, it turned strongly negative beginning in January. By mid-January, the index reached nearly -5 sigma (five standard deviations) below average. The AO then shifted back to positive during the last week of January.
Notable global heat and cold marks set for January 2016
Hottest temperature in the Northern Hemisphere: 43.0°C (109.4°F) at Linguere , Senegal, January 13
Coldest temperature in the Northern Hemisphere: -55.3°C (-67.5°F) at Summit, Greenland, January 31
Hottest temperature in the Southern Hemisphere: 48.6°C (119.5°F) at Augrabies Falls, South Africa, January 5
Coldest temperature in the Southern Hemisphere: -46.3°C (-51.3°F) at Dome Fuji, Antarctica, January 28
(Courtesy of Maximiliano Herrera.)
Major weather stations that set (not tied) new all-time heat or cold records in January 2016
Sutherland (South Africa) max. 37.9°C, 4 January
Kimberley (South Africa) max. 43.3°C, 5 January
Prieska (South Africa) max. 44.7°C, 5 January
Fraserburg (South Africa) max. 41.2°C, 5 January
De Aar (South Africa) max. 42.8°C, 5 January
Upington (South Africa) max. 45.3°C, 5 January
Vanwyksvlei (South Africa) max. 43.9°C, 5 January
Queenstown (South Africa) max. 42.9°C, 5 January
Pofadder (South Africa) max. 42.4°C, 5 January
Buffelsfontein (South Africa) max. 38.6°C, 5 January
Jamestown (South Africa) max. 38.7°C, 5 January
Cradock (South Africa) max. 43.8°C, 5 January
Van Zylsrus (South Africa) max. 45.4°C, 6 January
Kuruman (South Africa) max. 44.3°C, 6 January
Bloemhof (South Africa) max. 43.7°C, 6 January
Bloemfontein Airport (South Africa) max. 42.0°C, 6 January
Bloemfontein City (South Africa) max. 41.4°C, 6 January
Glen College (South Africa) max. 43.2°C, 6 January
Twee Riviere (South Africa) max. 45.4°C, 6 January
Welkom (South Africa) max. 41.4°C, 6 January
Ottosdal (South Africa) max. 42.4°C, 6 January
Estcourt (South Africa) max. 41.7°C, 6 January
Vryburg (South Africa) max. 43.7°C, 6 January
Ladysmith (South Africa) max. 43.0°C, 6 January
Taung (South Africa) max. 44.6°C, 6 January
Bethlehem (South Africa) max. 37.4°C, 6 January
Kroonstad (South Africa) max. 41.0°C, 6 January
Bothaville (South Africa) max. 41.8°C, 6 January
Royal National Park (South Africa) max. 39.7°C, 6 January
Werda (Botswana) max. 43.3°C, 6 January
Tsabong (Botswana) max. 43.5°C, 6 January: New national record high for Botswana
Maun (Botswana) max. 43.8°C, 7 January: New national record high for Botswana
Gaborone (Botswana) max. 42.7°C, 7 January
Jwaneng (Botswana) max. 41.9°C, 7 January
Pretoria City (South Africa) max. 42.7°C, 7 January
Pretoria Airport (South Africa) max. 38.7°C, 7 January
Johannesburg (South Africa) max. 38.9°C, 7 January
Johannesburg Aiport (South Africa) max. 35.9°C, 7 January
Frankfort (South Africa) max. 40.4°C, 7 January
Rustenburg (South Africa) max. 41.6°C, 7 January
Oudestad (South Africa) max. 42.5°C, 7 January
Ellisras (South Africa) max. 44.5°C, 7 January
Thabazimbi (South Africa) max. 44.7°C, 7 January
Warmbaths Towoomba (South Africa) max. 43.7°C, 7 January
Marico (South Africa) max. 45.0°C, 7 January
Buffelspoort (South Africa) max. 42.4°C, 7 January
Mara (South Africa) max. 42.4, 7 January
Bulawayo Airport (Zimbabwe) max. 39.3°C, 7 January
Gweru (Zimbabwe) max. 37.0°C, 7 January
Binga (Zimbabwe) max. 42.4°C, 8 January
Futuna Aiport (Wallis and Futuna, France) max. 35.8°C, 10 January: New territorial record high for Wallis and Futuna
Ambon (Indonesia) max. 36.0°C, 22 January
Xiamen (China) min. 0.1°C, 24 January
Fuzhou (China) min. -1.9°C, 24 January
Dachen Dao (China) min. -4.1°C, 24 January
Dongsha Dao (China) min. 12.6°C, 24 January
Tai Mo Shan (Hong Kong, China) min. -5.7°C, 24 January: New Territorial record low for Hong Kong
Su' ao (Taiwan) min. 5.0°C, 24 January
Xinwu (Taiwan) min. 4.2°C, 24 January
Anbu (Taiwan) min. -3.7°C, 24 January
Zhuzihu (Taiwan) min. -1.5°C, 24 January
Kinmen (Taiwan) min. 1.3°C, 24 January
Matsu (Taiwan) min. 0.3°C, 24 January
Onoaida (Japan) min. 0.6°C, 24 January
Okinoerabu (Japan) min. 4.7°C, 24 January
Hitoyoshi (Japan) min. -9.8°C, 25 January
Okuchi (Japan) min. -15.2°C, 25 January
Ue (Japan) min. -13.8°C, 25 January
Kakutou (Japan) min. -12.0°C, 25 January
Satsuma-Kashiwabaru (Japan) min. -10.8°C, 25 January
Tashiro (Japan) min. -10.4°C, 25 January
Shiroishi (Japan) min. -9.6°C, 25 January
Tokashiki (Japan) min. 3.7°C, 25 January
Itokazu (Japan) min. 4.1°C, 25 January
Izena (Japan) min. 5.2°C, 25 January
Ibaruma (Japan) min. 7.6°C, 25 January
Sibolga (Indonesia) max. 37.1°C, 27 January
(Courtesy of Maximiliano Herrera.)
Three all-time national heat records and one all-time cold record set through mid-February 2016
Just over one month into the year, three nations or territories have tied or set all-time records for their hottest temperature in recorded history in 2016, and one (Hong Kong) has set an all-time cold temperature record. Most nations do not maintain official databases of extreme temperature records, so the national temperature records reported here are in many cases not official. I use as my source for international weather records researcher Maximiliano Herrera, one of the world's top climatologists, who maintains a comprehensive list of extreme temperature records for every nation in the world on his website. If you reproduce this list of extremes, please cite Maximiliano Herrera as the primary source of the weather records. Wunderground's weather historian Christopher C. Burt maintains a database of these national heat and cold records for 235 nations and territories on wunderground.com's extremes page. Here are 2016's all-time heat and cold records so far:
Botswana set its all-time hottest record on January 7, 2016, when the mercury hit 43.8°C (110.8°F) at Maun. The old record was set just the previous day (January 6, 2016) with 43.5°C (110.3°F) at Tsabong. The record heat in Botswana during the first week of January was part of a remarkable heat wave that affected much of southern Africa, causing at least $250 million in drought-related damages to South Africa in January. Mr. Herrera noted in an email to me that temperatures in South Africa at elevations between 1000 and 1600 meters were higher than any previous temperatures ever recorded at those altitudes anywhere in the world. The national heat records of Lesotho, Mozambique, Namibia, and Swaziland might all have fallen were it not for the lack of observing stations in the hottest areas. Lesotho has no weather stations that issue the standard "synoptic" weather observations every six hours anymore; Mozambique and Swaziland have closed all their stations in the hottest areas; and Namibia just closed its Noordower station, which was its hottest station.
Wallis and Futuna Territory (France) set a new territorial heat record with 35.8°C (96.4°F) on January 10, 2016 at Futuna Airport. This is the second year in a row that Wallis and Futuna has beaten its all-time heat mark; the previous record was a 35.5°C (95.9°F) reading on January 19, 2015 at the Futuna Airport.
Vanuatu in the South Pacific set its all-time national heat record on February 8, 2016, when the mercury hit 36.2°C (97.2°F) at Lamap Malekula. The previous record was a 35.7°C (96.3°F) reading just the previous day (February 7, 2016) at the Bauerfield Efate Airport. All seven major weather reporting stations in Vanuatu beat or tied their all-time heat records February 7 - 8, 2016.
Hong Kong Territory (China) set its all-time coldest mark on January 24, 2016, when the mercury dipped to -5.7°C (21.7°F) at Tai Mo Shan.
We'll have a new post on Friday.
Jeff Masters
The views of the author are his/her own and do not necessarily represent the position of The Weather Company or its parent, IBM.