WunderBlog Archive » Category 6™
Category 6 has moved! See the latest from Dr. Jeff Masters and Bob Henson here.A New Tool for Gauging the Odds that a Storm Will Turn Severe
Will that thunderstorm become severe? It’s a question asked countless times each spring across the nation’s severe-weather corridors, not only by the public but also by forecasters in the National Weather Service. NOAA’s Storm Prediction Center issues convective outlooks that paint the broad picture of where severe weather is expected each day over the next week. SPC also coordinates with local offices on the placement of severe weather watches. It’s then up to local NWS forecasters to keep track of fast-breaking storm evolution and issue the county-scale warnings that millions of people act on. According to NWS severe storm services leader John Ferree, NWS offices issued more than 22,000 tornado warnings and more than 145,000 severe thunderstorm warnings in the seven-year period from 2008 through 2014.
Here at NOAA’s Hazardous Weather Testbed (HWT) in Norman, OK, I’m observing the first week of the annual Spring Experiment. The goal is to test promising new technologies that can advance the lead time and accuracy of warnings and “nowcasts.” Researchers from around the country will be filtering in and out of the HWT throughout the Spring Experiment. Each week, several forecasters from local NWS offices, plus one broadcast meteorologist, will also set up shop in Norman. These forecasters are issuing warnings with prototype tools just as if they were on an operational shift, so the pace is fast and intense, but these warnings don’t go out to the public, and the forecasters aren’t being graded on accuracy. Instead, they’re providing a running account of their experience—what worked best, what could be tweaked, and the like—in the form of live blogs with narratives and screenshots. According to experiment coordinator Gabriel Garfield (NWS/Norman), “We want the forecasters to be able to slip out of their comfort zones and think about how they can use probabilities in decision making.”
At the end of each week, the forecasters will summarize their work in a “Tales from the Testbed” webinar for colleagues in Norman and beyond. All this input will help refine the tools being studied, some of which will roll into regular NWS operations over the next few years.

Figure 1. Holly Obermeier (left), a broadcast meteorologist with Omaha’s KETV, confers with Steven Fleegel, a forecaster at the NWS office in Marquette, MI. Image credit: Bob Henson.
ProbSevere: A new window on storm evolution
The Spring Experiment is a sprawling, multifaceted project, as evident from the capsule descriptions on its webpage. Here’s one snapshot of a single tool now in its second year of testing: the ProbSevere model. It gauges the likelihood that a particular storm’s first instance of severe weather will occur during the next 60 minutes. Once a storm is established as severe, public awareness is easier to sustain, but anticipating that first appearance of high wind and/or large hail—before people on the ground know that a storm is severe—is crucial. The goal of ProbSevere is to give forecasters the equivalent of several radar scans of advance notice (about 10 extra minutes, on average) that a storm is approaching severe levels.
ProbSevere is based on a statistical blend of five measures linked to storm intensification:
—Instability (MUCAPE), provided by hourly updates from the Rapid Refresh forecast model
—Vertical wind shear, also provided by Rapid Refresh
—How quickly the top of the storm is rising, as deduced by satellite data
—How quickly ice crystals are forming (glaciation), also derived from satellite
—The diameter of the largest hailstones, as estimated by the Multi-Radar/Multi-Sensor System (MRMS).
Sometimes the environmental conditions will point toward severe weather before the MRMS values indicate severe hail, or vice versa. Since each storm follows a unique path to severity, ProbSevere relies on an equally weighted blend of the five indices above, rather than a simple “yes/no” verdict from any single index. The result is a single percentage-based probability that an initial severe report will occur in the next hour (see Figure 2). These probabilities can rise dramatically over just a few minutes, so forecasters at the experiment are watching for such trends in ProbSevere to gain more confidence that a severe thunderstorm warning may be justified. Other tools being tested this spring can also help make the call, such as an algorithm that detects a sudden jump in the total amount of lightning being generated by a storm. I’ll cover some more of these tools later in the week. Many are designed to take advantage of data from sensors aboard GOES-R, the first of the next-generation GOES satellites that will be deployed over the next few years. GOES-R is scheduled for launch in spring 2016.
ProbSevere was developed by NOAA and the Cooperative Institute for Meteorological Satellite Studies. You can check out the model for yourself at the ProbSevere website. The CIMSS Satellite Blog also has a helpful set of posts from the last year demonstrating ProbSevere through several case studies. A frequently updated subset of the daily liveblogs produced by forecasters at the Spring Experiment can be found at the GOES-R Proving Ground (HWT) blog.

Figure 2. At 4:08 pm CDT Monday, the NOAA/CIMSS ProbSevere model assigned an 89% chance that the storm shown here (outlined in magenta) in far northeast Kansas will produce its first instance of severe weather over the next hour. The probability is based on a statistical blend of the five indices shown in the text block next to the storm. These refer to instability, wind shear, hail size, the storm’s vertical growth rate, and glaciation (the pace of ice crystal formation within the thunderstorm). One of the forecast teams issued a non-public experimental severe thunderstorm warning at 4:17 pm CDT. No severe reports had come in by Tuesday morning for the time period of the warning, but in many cases severe weather in sparsely populated areas cannot be confirmed—and of course, even an 89% chance of severe weather means that no severe reports would be expected 11% of the time. Image credit: Kristin Calhoun, National Severe Storms Laboratory.
A week of deluge and severe weather
After years of intense drought, the plains of West Texas are soaking up one of their best episodes of spring rainfall in years. Several rounds of storms overnight produced 24-hour rainfall totals of 3 - 5” from the Lubbock area south toward Midland, and one cooperative observer in the town of Tahoka reported 9.10”. Four of the last six years gave Lubbock less than 13” of rain each, so apart from localized flash flooding, this is a much-appreciated dousing. As energy dives in and out of the upper-level low over the Southwest, the corridor of repeated storm development will shift only very slowly eastward over the next few days. This will keep the tap running from Texas across Oklahoma and Kansas as well as northeast Colorado, where atmospheric moisture is at near-record levels for this time of year.

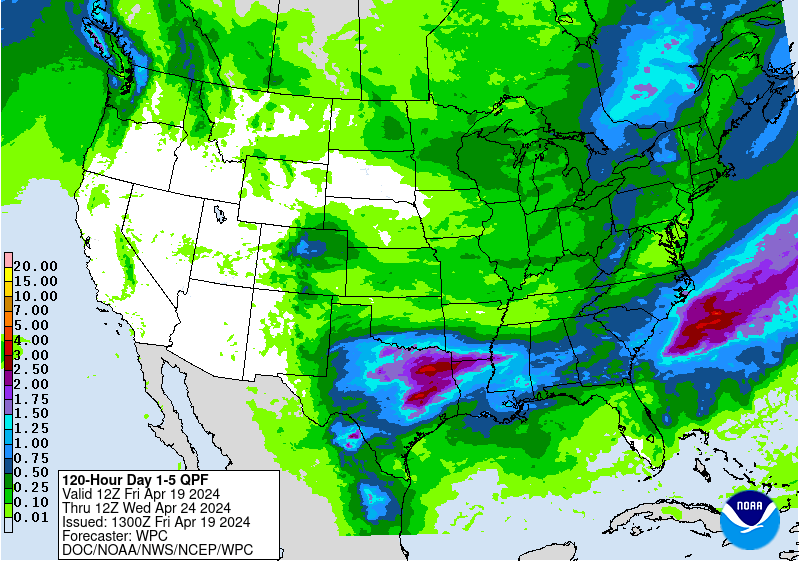
Figure 3. NOAA’s Weather Prediction Center is calling for general rainfall totals on the order of 2 - 5” across much of north Texas, Oklahoma, Kansas, and northeast Colorado from Tuesday through Sunday. Image credit: NOAA/WPC.
Severe weather is a possibility each day this week, although the extensive rain and clouds will tend to tamp down the available instability. If early-day storms clear out in time, conditions appear ripe for more significant severe weather along a dry line in western Oklahoma and Kansas late Wednesday, perhaps extending into the central Plains on Thursday. A more widespread bout of severe weather is quite possible from Texas to Kansas by Saturday, as the main upper low begins to lift out. The likelihood of tornadoes should rise by that point. However, given that it’s May on the Great Plains—the equivalent of September in hurricane country—a stray tornado is possible on just about any afternoon this week. On Monday night, storm chasers from Australia caught images of a dramatic but nondestructive tornado near Garden City, KS (see Figure 4), and a Tuesday afternoon twister struck several miles southwest of Roswell, NM. However, the most dramatic tornado damage of the last 24 hours occurred in northern Germany, where the town of Bützow experienced significant impacts and a number of injuries.
Watching for subtropical development off the Florida coast
Models continue to indicate that a cluster of heavy showers and thunderstorms north of the Bahamas will consolidate into low pressure that may become a subtropical cyclone later this week. See the Jeff Masters post from earlier today for more details. Jeff will have a full update on Wednesday.
Bob Henson

Figure 4. This picturesque tornado was photographed by Clyve Herbert and Jane ONeill (Australian Sky and Weather). A tornadic signature was evident in Doppler wind data (upper left), and a hook appeared in the precipitation data (upper right). Graphic credit: NWS/Dodge City.
Here at NOAA’s Hazardous Weather Testbed (HWT) in Norman, OK, I’m observing the first week of the annual Spring Experiment. The goal is to test promising new technologies that can advance the lead time and accuracy of warnings and “nowcasts.” Researchers from around the country will be filtering in and out of the HWT throughout the Spring Experiment. Each week, several forecasters from local NWS offices, plus one broadcast meteorologist, will also set up shop in Norman. These forecasters are issuing warnings with prototype tools just as if they were on an operational shift, so the pace is fast and intense, but these warnings don’t go out to the public, and the forecasters aren’t being graded on accuracy. Instead, they’re providing a running account of their experience—what worked best, what could be tweaked, and the like—in the form of live blogs with narratives and screenshots. According to experiment coordinator Gabriel Garfield (NWS/Norman), “We want the forecasters to be able to slip out of their comfort zones and think about how they can use probabilities in decision making.”
At the end of each week, the forecasters will summarize their work in a “Tales from the Testbed” webinar for colleagues in Norman and beyond. All this input will help refine the tools being studied, some of which will roll into regular NWS operations over the next few years.
Figure 1. Holly Obermeier (left), a broadcast meteorologist with Omaha’s KETV, confers with Steven Fleegel, a forecaster at the NWS office in Marquette, MI. Image credit: Bob Henson.
ProbSevere: A new window on storm evolution
The Spring Experiment is a sprawling, multifaceted project, as evident from the capsule descriptions on its webpage. Here’s one snapshot of a single tool now in its second year of testing: the ProbSevere model. It gauges the likelihood that a particular storm’s first instance of severe weather will occur during the next 60 minutes. Once a storm is established as severe, public awareness is easier to sustain, but anticipating that first appearance of high wind and/or large hail—before people on the ground know that a storm is severe—is crucial. The goal of ProbSevere is to give forecasters the equivalent of several radar scans of advance notice (about 10 extra minutes, on average) that a storm is approaching severe levels.
ProbSevere is based on a statistical blend of five measures linked to storm intensification:
—Instability (MUCAPE), provided by hourly updates from the Rapid Refresh forecast model
—Vertical wind shear, also provided by Rapid Refresh
—How quickly the top of the storm is rising, as deduced by satellite data
—How quickly ice crystals are forming (glaciation), also derived from satellite
—The diameter of the largest hailstones, as estimated by the Multi-Radar/Multi-Sensor System (MRMS).
Sometimes the environmental conditions will point toward severe weather before the MRMS values indicate severe hail, or vice versa. Since each storm follows a unique path to severity, ProbSevere relies on an equally weighted blend of the five indices above, rather than a simple “yes/no” verdict from any single index. The result is a single percentage-based probability that an initial severe report will occur in the next hour (see Figure 2). These probabilities can rise dramatically over just a few minutes, so forecasters at the experiment are watching for such trends in ProbSevere to gain more confidence that a severe thunderstorm warning may be justified. Other tools being tested this spring can also help make the call, such as an algorithm that detects a sudden jump in the total amount of lightning being generated by a storm. I’ll cover some more of these tools later in the week. Many are designed to take advantage of data from sensors aboard GOES-R, the first of the next-generation GOES satellites that will be deployed over the next few years. GOES-R is scheduled for launch in spring 2016.
ProbSevere was developed by NOAA and the Cooperative Institute for Meteorological Satellite Studies. You can check out the model for yourself at the ProbSevere website. The CIMSS Satellite Blog also has a helpful set of posts from the last year demonstrating ProbSevere through several case studies. A frequently updated subset of the daily liveblogs produced by forecasters at the Spring Experiment can be found at the GOES-R Proving Ground (HWT) blog.
Figure 2. At 4:08 pm CDT Monday, the NOAA/CIMSS ProbSevere model assigned an 89% chance that the storm shown here (outlined in magenta) in far northeast Kansas will produce its first instance of severe weather over the next hour. The probability is based on a statistical blend of the five indices shown in the text block next to the storm. These refer to instability, wind shear, hail size, the storm’s vertical growth rate, and glaciation (the pace of ice crystal formation within the thunderstorm). One of the forecast teams issued a non-public experimental severe thunderstorm warning at 4:17 pm CDT. No severe reports had come in by Tuesday morning for the time period of the warning, but in many cases severe weather in sparsely populated areas cannot be confirmed—and of course, even an 89% chance of severe weather means that no severe reports would be expected 11% of the time. Image credit: Kristin Calhoun, National Severe Storms Laboratory.
A week of deluge and severe weather
After years of intense drought, the plains of West Texas are soaking up one of their best episodes of spring rainfall in years. Several rounds of storms overnight produced 24-hour rainfall totals of 3 - 5” from the Lubbock area south toward Midland, and one cooperative observer in the town of Tahoka reported 9.10”. Four of the last six years gave Lubbock less than 13” of rain each, so apart from localized flash flooding, this is a much-appreciated dousing. As energy dives in and out of the upper-level low over the Southwest, the corridor of repeated storm development will shift only very slowly eastward over the next few days. This will keep the tap running from Texas across Oklahoma and Kansas as well as northeast Colorado, where atmospheric moisture is at near-record levels for this time of year.
Figure 3. NOAA’s Weather Prediction Center is calling for general rainfall totals on the order of 2 - 5” across much of north Texas, Oklahoma, Kansas, and northeast Colorado from Tuesday through Sunday. Image credit: NOAA/WPC.
Severe weather is a possibility each day this week, although the extensive rain and clouds will tend to tamp down the available instability. If early-day storms clear out in time, conditions appear ripe for more significant severe weather along a dry line in western Oklahoma and Kansas late Wednesday, perhaps extending into the central Plains on Thursday. A more widespread bout of severe weather is quite possible from Texas to Kansas by Saturday, as the main upper low begins to lift out. The likelihood of tornadoes should rise by that point. However, given that it’s May on the Great Plains—the equivalent of September in hurricane country—a stray tornado is possible on just about any afternoon this week. On Monday night, storm chasers from Australia caught images of a dramatic but nondestructive tornado near Garden City, KS (see Figure 4), and a Tuesday afternoon twister struck several miles southwest of Roswell, NM. However, the most dramatic tornado damage of the last 24 hours occurred in northern Germany, where the town of Bützow experienced significant impacts and a number of injuries.
Watching for subtropical development off the Florida coast
Models continue to indicate that a cluster of heavy showers and thunderstorms north of the Bahamas will consolidate into low pressure that may become a subtropical cyclone later this week. See the Jeff Masters post from earlier today for more details. Jeff will have a full update on Wednesday.
Bob Henson
Figure 4. This picturesque tornado was photographed by Clyve Herbert and Jane ONeill (Australian Sky and Weather). A tornadic signature was evident in Doppler wind data (upper left), and a hook appeared in the precipitation data (upper right). Graphic credit: NWS/Dodge City.
The views of the author are his/her own and do not necessarily represent the position of The Weather Company or its parent, IBM.