WunderBlog Archive » Category 6™
Category 6 has moved! See the latest from Dr. Jeff Masters and Bob Henson here.A Mostly Mild and Dry January for U.S., Punctuated by Big Storms
The strong El Niño event dubbed “Godzilla” by one oceanographer behaved more like a hero than a monster in January, at least when it came to conditions across the United States. Mild and dry weather prevailed over much of the nation, and where it was wet or snowy, the moisture was generally well predicted and widely appreciated, apart from a titanic Northeast snowstorm (see below).
Last month was the 34th warmest and 36th driest January for the contiguous U.S., according to the roundup released on Wednesday by the NOAA National Centers for Environmental Information (NCEI). The stark west-to-east temperature contrasts that prevailed during January 2013, 2014, and 2015 were absent this time around. Instead, there was a more muted contrast between relative mildness over the West and Northeast and below-average readings across the Southeast. This matches well with the typical outcome in January during strong El Niño events. The month’s overall mildness shows up in the lopsided 4-to-1 ratio of daily record highs to daily record lows (646 to 156).

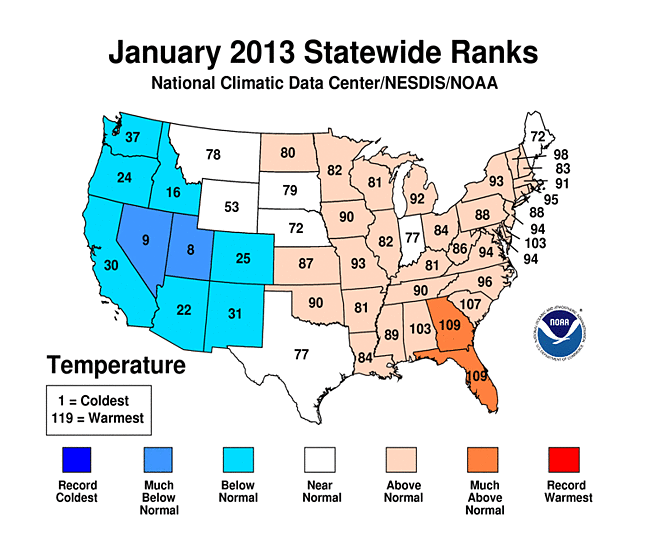
Figure 1. State-by-state temperature rankings for January 2016. The rankings go from warmest (122) to coldest (1) for the 122 years of record-keeping from 1895 to 2016. This year, none of the contiguous U.S. states had a top-ten warmest or coldest January. Image credit: NOAA/NCEI.

Figure 2. State-by-state precipitation rankings for January 2016. The rankings go from wettest (122) to driest (1) for the 122 years of record-keeping from 1895 to 2016. This year, Florida had its fourth wettest January on record, and Ohio had its ninth driest. Image credit: NOAA/NCEI.
Florida and the West win the precipitation sweepstakes
Northern states are typically drier than average in a strong El Niño--especially the Ohio Valley--and that was the case in January, with the state of Ohio recording its ninth driest January on record (see Figure 2). But the dryness extended well southward across the Southern Plains and Southeast, regions that are typically moister than average during major El Niños. Florida is one place where the wet expectations from El Niño were more than met, as a potent and persistent subtropical jet helped the state notch its fourth wettest January on record. It was the wettest January ever observed in Fort Myers (12.98”) and Vero Beach (9.39”) and the second wettest in Miami (7.57”).
Moisture was also plentiful across the southwest U.S., again in line with the pattern from previous strong El Niños. The focus in California was on the northern two-thirds of the state, where several locations scored 150% to 200% of their average January precipitation. Snowpack across the Sierra Nevada--crucial for summer water supplies--grew to 113% of average by the end of January, the first above-normal value in January since 2011. Generous snowfall extended east across parts of the central and southern Great Basin, again typical of El Niño. In a more unexpected wrinkle, heavy rains and snows pushed all the way north to Washington, where El Niño midwinters tend to skew dry. With 7.45” of rain in January following 11.21” in December, Seattle ended up with its wettest December-January period on record.
According to the January 2016 Catastrophe Report from insurance broker Aon Benfield, El Niño-fueled Pacific storms that brought heavy rainfall, snow and isolated severe weather to portions of California in early January caused flooding, mudslides and debris flows that cost at least $125 million. For comparison, El Niño storms during the great 1997 - 1998 El Niño caused nearly $500 million in damage to the state.
Among the noteworthy dry spots were Honolulu, Hawaii (second driest January on record, with 0.03” of rain); Fairbanks, Alaska (tied for driest, with only 0.01” of precipitation); and Jamestown, North Dakota (driest on record, with just a trace). All three locations have a dry tendency during El Niño midwinters.

Figure 3. The rising sun illuminates a snow-covered scene in front of the White House on January 26, 2016, in Washington, D.C. Image credit: Mark Wilson/Getty Images.

Figure 4. A woman attempts to dig her car out from beneath heavy snow in the Columbia Heights neighborhood of Washington, D.C., on Tuesday, January 26, 2016, following the weekend blizzard. Image credit: Chip Somodevilla/Getty Images.
Weather whiplash to the max: Balmy, then buried
A wrenching shift in weather occurred across the mid-Atlantic and Northeast on the weekend of January 22-24, when a previously tranquil month for millions of residents was interrupted by a ferocious, city-blanketing nor’easter that was dubbed Winter Storm Jonas by the Weather Channel. The region was just coming off record-smashing warmth during the end-of-year holidays. Jonas arrived only a few days after Philadelphia and Washington, D.C., had gotten their first flakes of snow for the winter--on January 12, a record-late date for both cities.
According to NCEI, eight of the 35 major airport weather stations in the Northeast received their heaviest single-day snowfall on record on January 23. Storm totals exceeded 25” from parts of Virginia to New York (see Figure 5 below). With some of the heaviest snow focused on the urban corridor from Washington to New York City, Jonas ended up ranked as the fourth most impactful snowstorm of the last 66 years in the Northeast Snowfall Impact Scale (NESIS), which takes into account the area and the number of people affected by a snowstorm as well as the amount of snow that fell.
The intensity of this blizzard was evident days ahead of time, and the storm’s arrival on a weekend helped reduce its impact. Still, Jonas caused at least $2 billion in losses, according to insurance broker Aon Benfield. At least 55 deaths were reported, many from traffic accidents or from heart attacks induced by shoveling snow.

Figure 5. Snowfall accumulations during the Megapolitan storm of Feb. 10-12, 1983 (left) and the blizzard of Jan. 22-24, 2016 (right). Image credit: NOAA/NCEI.
It’s happened before: Epic Northeast snow during a strong El Niño
As Jon Erdman explains in a comprehensive weather.com article, some of the snowiest winters across the Northeast have occurred when El Niño is accompanied by a predominantly negative North Atlantic Oscillation (NAO). This combo allows Arctic air to mix it up with moisture-laden flow from the tropics and a powerful subtropical jet stream. Though the NAO has mostly been in a positive mode this winter, it briefly turned negative in mid-January, just before Jonas arrived.
There’s an excellent historical precedent for a record-burying Northeast snowstorm in the midst of an otherwise placid El Niño winter. The “super” El Niño of 1982-83 was largely free of major winter storms across the Northeast, except for the memorable Megapolitan blizzard of February 10-12, 1983. Figure 5 shows the similarity between the 1983 and 2016 events. Both storms were followed by a rapid meltoff, especially in the D.C. area, where highs climbed well into the 40s and 50s for at least 10 days after each storm cleared out.
We’ll be back with a new post by Friday afternoon.
Bob Henson
Last month was the 34th warmest and 36th driest January for the contiguous U.S., according to the roundup released on Wednesday by the NOAA National Centers for Environmental Information (NCEI). The stark west-to-east temperature contrasts that prevailed during January 2013, 2014, and 2015 were absent this time around. Instead, there was a more muted contrast between relative mildness over the West and Northeast and below-average readings across the Southeast. This matches well with the typical outcome in January during strong El Niño events. The month’s overall mildness shows up in the lopsided 4-to-1 ratio of daily record highs to daily record lows (646 to 156).
Figure 1. State-by-state temperature rankings for January 2016. The rankings go from warmest (122) to coldest (1) for the 122 years of record-keeping from 1895 to 2016. This year, none of the contiguous U.S. states had a top-ten warmest or coldest January. Image credit: NOAA/NCEI.
Figure 2. State-by-state precipitation rankings for January 2016. The rankings go from wettest (122) to driest (1) for the 122 years of record-keeping from 1895 to 2016. This year, Florida had its fourth wettest January on record, and Ohio had its ninth driest. Image credit: NOAA/NCEI.
Florida and the West win the precipitation sweepstakes
Northern states are typically drier than average in a strong El Niño--especially the Ohio Valley--and that was the case in January, with the state of Ohio recording its ninth driest January on record (see Figure 2). But the dryness extended well southward across the Southern Plains and Southeast, regions that are typically moister than average during major El Niños. Florida is one place where the wet expectations from El Niño were more than met, as a potent and persistent subtropical jet helped the state notch its fourth wettest January on record. It was the wettest January ever observed in Fort Myers (12.98”) and Vero Beach (9.39”) and the second wettest in Miami (7.57”).
Moisture was also plentiful across the southwest U.S., again in line with the pattern from previous strong El Niños. The focus in California was on the northern two-thirds of the state, where several locations scored 150% to 200% of their average January precipitation. Snowpack across the Sierra Nevada--crucial for summer water supplies--grew to 113% of average by the end of January, the first above-normal value in January since 2011. Generous snowfall extended east across parts of the central and southern Great Basin, again typical of El Niño. In a more unexpected wrinkle, heavy rains and snows pushed all the way north to Washington, where El Niño midwinters tend to skew dry. With 7.45” of rain in January following 11.21” in December, Seattle ended up with its wettest December-January period on record.
According to the January 2016 Catastrophe Report from insurance broker Aon Benfield, El Niño-fueled Pacific storms that brought heavy rainfall, snow and isolated severe weather to portions of California in early January caused flooding, mudslides and debris flows that cost at least $125 million. For comparison, El Niño storms during the great 1997 - 1998 El Niño caused nearly $500 million in damage to the state.
Among the noteworthy dry spots were Honolulu, Hawaii (second driest January on record, with 0.03” of rain); Fairbanks, Alaska (tied for driest, with only 0.01” of precipitation); and Jamestown, North Dakota (driest on record, with just a trace). All three locations have a dry tendency during El Niño midwinters.
Figure 3. The rising sun illuminates a snow-covered scene in front of the White House on January 26, 2016, in Washington, D.C. Image credit: Mark Wilson/Getty Images.
Figure 4. A woman attempts to dig her car out from beneath heavy snow in the Columbia Heights neighborhood of Washington, D.C., on Tuesday, January 26, 2016, following the weekend blizzard. Image credit: Chip Somodevilla/Getty Images.
Weather whiplash to the max: Balmy, then buried
A wrenching shift in weather occurred across the mid-Atlantic and Northeast on the weekend of January 22-24, when a previously tranquil month for millions of residents was interrupted by a ferocious, city-blanketing nor’easter that was dubbed Winter Storm Jonas by the Weather Channel. The region was just coming off record-smashing warmth during the end-of-year holidays. Jonas arrived only a few days after Philadelphia and Washington, D.C., had gotten their first flakes of snow for the winter--on January 12, a record-late date for both cities.
According to NCEI, eight of the 35 major airport weather stations in the Northeast received their heaviest single-day snowfall on record on January 23. Storm totals exceeded 25” from parts of Virginia to New York (see Figure 5 below). With some of the heaviest snow focused on the urban corridor from Washington to New York City, Jonas ended up ranked as the fourth most impactful snowstorm of the last 66 years in the Northeast Snowfall Impact Scale (NESIS), which takes into account the area and the number of people affected by a snowstorm as well as the amount of snow that fell.
The intensity of this blizzard was evident days ahead of time, and the storm’s arrival on a weekend helped reduce its impact. Still, Jonas caused at least $2 billion in losses, according to insurance broker Aon Benfield. At least 55 deaths were reported, many from traffic accidents or from heart attacks induced by shoveling snow.
Figure 5. Snowfall accumulations during the Megapolitan storm of Feb. 10-12, 1983 (left) and the blizzard of Jan. 22-24, 2016 (right). Image credit: NOAA/NCEI.
It’s happened before: Epic Northeast snow during a strong El Niño
As Jon Erdman explains in a comprehensive weather.com article, some of the snowiest winters across the Northeast have occurred when El Niño is accompanied by a predominantly negative North Atlantic Oscillation (NAO). This combo allows Arctic air to mix it up with moisture-laden flow from the tropics and a powerful subtropical jet stream. Though the NAO has mostly been in a positive mode this winter, it briefly turned negative in mid-January, just before Jonas arrived.
There’s an excellent historical precedent for a record-burying Northeast snowstorm in the midst of an otherwise placid El Niño winter. The “super” El Niño of 1982-83 was largely free of major winter storms across the Northeast, except for the memorable Megapolitan blizzard of February 10-12, 1983. Figure 5 shows the similarity between the 1983 and 2016 events. Both storms were followed by a rapid meltoff, especially in the D.C. area, where highs climbed well into the 40s and 50s for at least 10 days after each storm cleared out.
We’ll be back with a new post by Friday afternoon.
Bob Henson
The views of the author are his/her own and do not necessarily represent the position of The Weather Company or its parent, IBM.