WunderBlog Archive » Category 6™
Category 6 has moved! See the latest from Dr. Jeff Masters and Bob Henson here.2012: Earth's 10th warmest year on record, and warmest with a La Niña
It was another top-ten hottest year on record during 2012, which ranked as the 10th warmest year since records began in 1880, NOAA's National Climatic Data Center said today. NASA rated 2012 as the 9th warmest on record. Including 2012, all 12 years to date in the 21st century (2001–2012) rank among the 14 warmest in the 133-year period of record. Only one year during the 20th century--1998--was warmer than 2012. The year 2012 was the warmest year on record when a La Niña event was present. Global land temperatures were the 7th warmest on record, and ocean temperatures were the 10th warmest. Global satellite-measured temperatures in the lower atmosphere were the 9th or 11th warmest in the 34-year record, according to UAH and RSS, respectively. Following the two wettest years on record (2010 and 2011), 2012 saw near average precipitation on balance across the globe. In a NASA Press Release today, climate scientist Gavin Schmidt said, "One more year of numbers isn't in itself significant. What matters is this decade is warmer than the last decade, and that decade was warmer than the decade before. The planet is warming. The reason it's warming is because we are pumping increasing amounts of carbon dioxide into the atmosphere."

Figure 1. Departure of global temperature from average for 2012. The continental U.S. and the eastern 2/3 of Canada were Earth's warmest regions, relative to average. Image credit: NOAA's National Climatic Data Center.
Global extremes of 2012
Weather records researcher Maximiliano Herrera has put together a list of global extremes for 2012, and maintains a comprehensive list of extreme temperature records for every nation in the world on his website. If you reproduce this list of extremes, please cite Maximiliano Herrera as the primary source of the weather records. Here, then, is Maximiliano's list of 2012 global extremes:
Hottest temperature in the world in 2012: 53.6°C (128.5°F) in Sulaibiya, Kuwait, July 31
Coldest temperature in the world in 2012: -84.2°C (-119.6°F) at Vostok, Antarctica, September 16
Hottest temperature in the Southern Hemisphere: 47.5°C (117.5°F) at Birdsville, Australia, January 7
Coldest temperature in the Northern Hemisphere: -63.1°C (-81.6°F) at Summit, Greenland, December 28
Highest annual precipitation: Cherrapunji, India, 13364 mm (526")
Lowest annual precipitation: Several stations in Southern Egypt saw not even a trace of precipitation
All-time world record warm minimum temperature tied: 41.7°C (107°F), Death Valley (USA), July 12
All-time world record highest 24-hour average temperature: 47.5°C (117.5°F), Death Valley (USA), July 11-12
World record high temperature in an island: 51.8°C (125.2°F), Failaka Island, Kuwait, July 31
World record high temperature on a coast: 52.1°C (125.8°F), Kuwait City, Kuwait, July 31
World record highest temperature with rain: 46.1°C (115°F), Needles (USA), August 13
World record for lowest humidity with rain: 11%, Needles (USA), August 13

Figure 2. True-color MODIS satellite image of California and Arizona taken at 1:25 pm PDT August 13, 2012. Developing thunderstorms surround Needles, CA, and the line of clouds to the southwest of the city would develop into a thunderstorm that brought rain to the city at 4 pm PDT, at a temperature of 115°F and a relative humidity of 11%--both world records. Image credit: NASA.
New country and territory hottest temperature records set in 2012
Five nations and two territories tied or set their hottest temperature readings in recorded history during 2012; no coldest all-time national records were set. For comparison, Seven countries and one territory set all-time hottest temperature records in 2011, and one nation set an all-time coldest temperature record. The most all-time national heat records in a year occurred in 2010, when twenty nations and one territory did so. Here are the 2012 national heat records:
Morocco recorded its hottest temperature on record on July 17, 2012 in Marrakech, when the mercury hit 49.6°C (121.3°F).
Kuwait recorded its hottest temperature on record on July 31, 2012 in Sulaibya, when the mercury hit 53.6°C (128.5°F). This surpasses the highest undisputed temperature ever recorded in Asia--the 53.5°C (128.3°F) measured at Moen Jo-Daro, Pakistan on May 26, 2010. The only higher temperature ever measured in Asia was a 54°C (129.2°F) reading from Tirat Tsvi, Israel on June 22, 1942. The Israeli Met Office pursued an investigation of the record in 2012 (prompted by an inquiry from the WMO and wunderground's weather historian Christopher C. Burt), and concluded that the record was valid. However, they have refused to make public the details leading to their conclusions, and until they do so, the record remains suspect.
Moldova recorded its hottest temperature on record on August 7, 2012 in Falesti, when the mercury hit 42.4°C (108.3°F).
Montenegro tied its hottest temperature on record on August 8, 2012 in Danilovgrad, when the mercury hit 44.8°C (112.6°F).
The Czech Republic recorded its hottest temperature on record on August 20, 2012 in Dobrichovice, when the mercury hit 40.4°C (104.7°F).
The territory of Hong Kong tied its hottest temperature on record on July 21 on Ping Chau Island, when the mercury hit 37.7°C (99.9°F).
The Sprska Republic set a new territorial high of 42.8°C (109°F) on August 24 at Visegrad.
New U.S. State Records set in 2012
New state record high: South Carolina, at Columbia University WS and Johnston, 45.0°C (113°F), June 29
State record high temperature tied: Colorado, at Las Animas, 45.6°C (114°F), June 23
Wunderground's weather historian Christopher C. Burt maintains a database of national heat and cold records on wunderground.com's extremes page, where all of this year's national heat records are updated. Weather records researcher Maximiliano Herrera is the primary source of these national weather records.
How much of the warming in recent decades is due to natural causes?
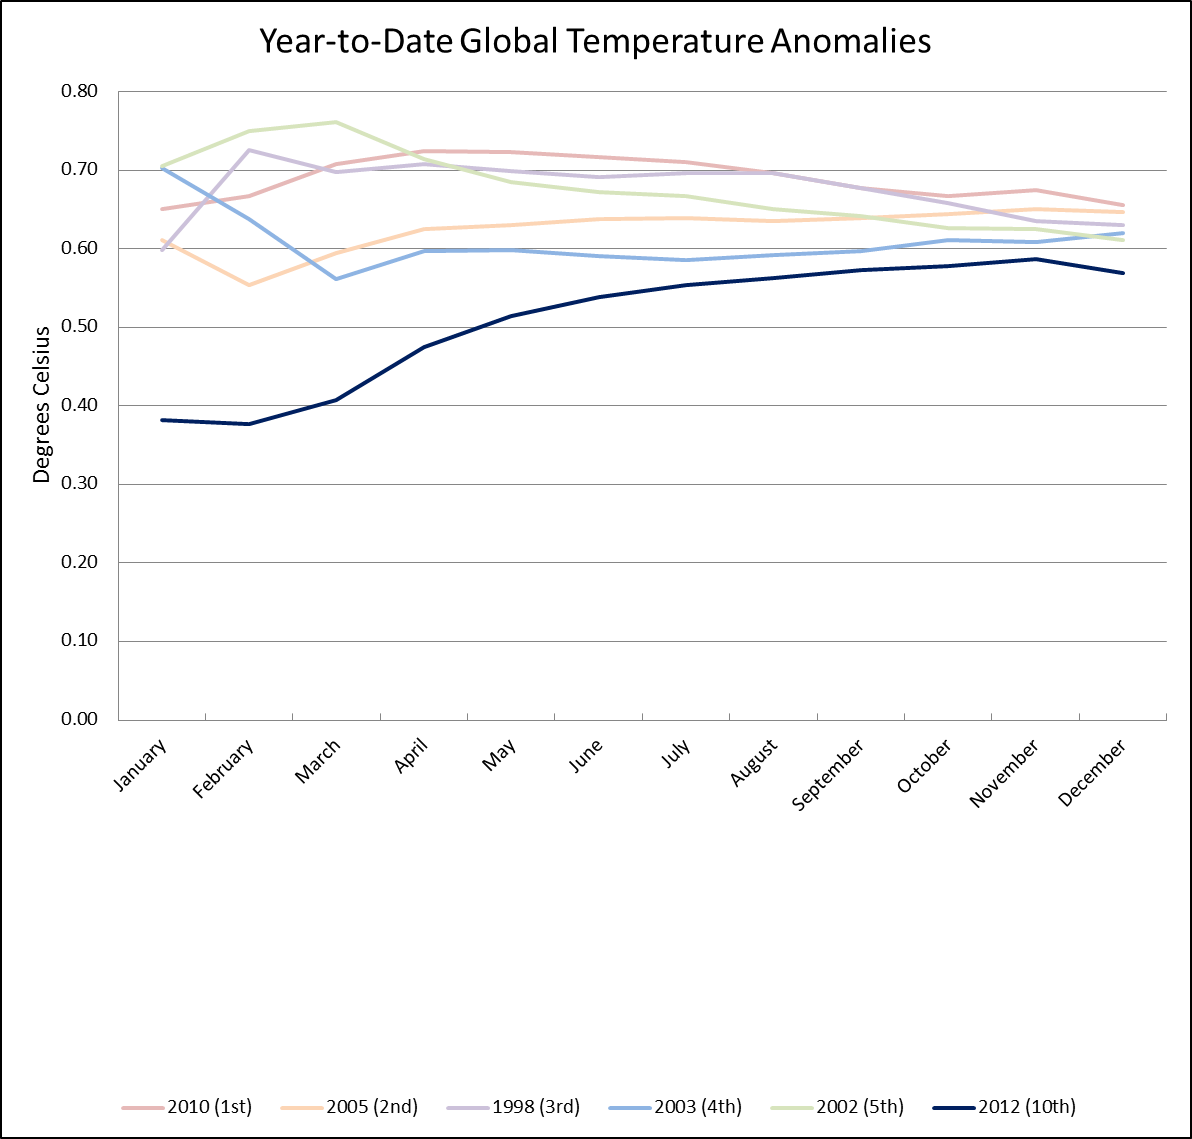
The El Niño/La Niña cycle causes cyclical changes in global temperatures that average out close to zero over the course of several decades. La Niña events bring a large amount of cold water to the surface in the equatorial Eastern Pacific, which cools global temperatures by up to 0.2°C. El Niño events have the opposite effect. During 2012, a weak La Niña event was present through March. Warming of the Eastern Pacific waters in the spring brought on neutral conditions, which lasted for the remainder of the year. The year 2012 was the warmest year on record when a La Niña event was present, surpassing the previous record set just the year before, in 2011. Global temperatures were 0.09°C (0.16°F) cooler than the record warmest year for the planet (2010), and 2012 would very likely have been the warmest on record had an El Niño event been present instead of a La Niña, as seen by looking at the year-to-date global temperature plot for 2012.

Figure 3. Departure from average of annual global temperatures between 1950 - 2012, classified by phase of the El Niño-Southern Oscillation (ENSO). The year 2012 was the warmest year on record when a La Niña event was present. ENSO is a natural episodic fluctuation in sea surface temperature (El Niño/La Niña) and the air pressure of the overlying atmosphere (Southern Oscillation) across the equatorial Pacific Ocean. Over a period of months to a few years, ENSO fluctuates between warmer-than-average ocean surface waters (El Niño) and cooler-than-average ocean surface waters (La Niña) in that region. Earth's warmest years tend to occur when an El Niño is present; cooler years occur when a La Niña is occurring. A La Niña (El Niño) year is defined here as occurring when the first three months of a calendar year meet the La Niña (El Niño) criteria as defined by NOAA's Climate Prediction Center. Image credit: National Climatic Data Center.
Correcting for natural causes to find the human contribution
We know that natural episodes of global warming or cooling in the distant past have been caused by changes in sunlight and volcanic dust. So, it is good to remove these natural causes of global temperature change over the past 34 years we have satellite data, to see what the human influence might have been during that time span. Through 2010, the three major research groups that maintain global surface temperature data sets (NCDC, GISS, and HadCRU) all show global temperatures have warmed by 0.16 - 0.17°C (0.28 - 0.30°F) per decade since satellite measurements began in 1979. The two satellite-based data sets of the lower atmosphere (maintained by UAH and RSS) give slightly less warming, about 0.14 - 0.15°C (.25 - .27°F) per decade (keep in mind that satellite measurements of the lower atmosphere temperature are affected much more strongly by volcanic eruptions and the El Niño phenomena than are surface-based measurements taken by weather stations.) A 2011 paper published by Grant Foster and Stefan Rahmstorf, Global temperature evolution 1979 - 2010, took these five major global temperature data sets and adjusted them to remove the influences of natural variations in sunlight, volcanic dust, and the El Niño/La Niña cycle. The researchers found that adjusting for these natural effects did not change the observed trend in global temperatures, which remained between 0.14 - 0.17°C (0.25 - 0.31°F) per decade in all five data sets. The warmest years since 1979 were 2010 and 2009 in all five adjusted data sets. The known natural causes of global warming have little to do with the observed increase in global temperatures over the past 34 years, and the vast majority of actively publishing climate scientists agree that human activity is the primary cause of increasing global temperatures in recent decades.

Figure 4. Departure from average of annual global temperatures between 1979 - 2010, adjusted to remove natural variations due to fluctuations in the El Niño-Southern Oscillation (ENSO) cycle, dust from volcanic eruptions, and changes in sunlight. The five most frequently-cited global temperature records are presented: surface temperature estimates by NASA's GISS, HadCRU from the UK, and NOAA's NCDC, and satellite-based lower-atmosphere estimates from Remote Sensing Systems, Inc. (RSS) and the University of Alabama Huntsville (UAH.) Image credit Global temperature evolution 1979- 2010 by Grant Foster and Stefan Rahmstorf, Environ. Res. Lett. 6, 2011, 044022 doi:10.1088/1748-9326/6/4/044022.
Video 1. Human emissions of heat-trapping gases like carbon dioxide have continued to warm the planet over the past 16 years. However, a persistent myth has emerged in the mainstream media challenging this. Denial of this fact may have been the favorite climate contrarian myth of 2012. Video courtesy of skepticalscience.com.
Top Ten Weather Lists for 2012
My Top Ten Global Weather Events of 2012
My Top Ten U.S. Weather Events of 2012.
NCDC's Top Ten Annual Weather/Climate Events
Wunderground's Angela Fritz's has a list of Top Climate Events of 2012.
A group of seventeen climate scientists and climate bloggers created a Climate Disruption: Critical 2012 Events and Stories list of 19 key climate change events that occurred in 2012.
TWC's Stu Ostro has his annual post showing his pick for top weather images of 2012.
Climate Central has a top-ten most striking images of 2012 post.
Jeff Masters
Figure 1. Departure of global temperature from average for 2012. The continental U.S. and the eastern 2/3 of Canada were Earth's warmest regions, relative to average. Image credit: NOAA's National Climatic Data Center.
Global extremes of 2012
Weather records researcher Maximiliano Herrera has put together a list of global extremes for 2012, and maintains a comprehensive list of extreme temperature records for every nation in the world on his website. If you reproduce this list of extremes, please cite Maximiliano Herrera as the primary source of the weather records. Here, then, is Maximiliano's list of 2012 global extremes:
Hottest temperature in the world in 2012: 53.6°C (128.5°F) in Sulaibiya, Kuwait, July 31
Coldest temperature in the world in 2012: -84.2°C (-119.6°F) at Vostok, Antarctica, September 16
Hottest temperature in the Southern Hemisphere: 47.5°C (117.5°F) at Birdsville, Australia, January 7
Coldest temperature in the Northern Hemisphere: -63.1°C (-81.6°F) at Summit, Greenland, December 28
Highest annual precipitation: Cherrapunji, India, 13364 mm (526")
Lowest annual precipitation: Several stations in Southern Egypt saw not even a trace of precipitation
All-time world record warm minimum temperature tied: 41.7°C (107°F), Death Valley (USA), July 12
All-time world record highest 24-hour average temperature: 47.5°C (117.5°F), Death Valley (USA), July 11-12
World record high temperature in an island: 51.8°C (125.2°F), Failaka Island, Kuwait, July 31
World record high temperature on a coast: 52.1°C (125.8°F), Kuwait City, Kuwait, July 31
World record highest temperature with rain: 46.1°C (115°F), Needles (USA), August 13
World record for lowest humidity with rain: 11%, Needles (USA), August 13
Figure 2. True-color MODIS satellite image of California and Arizona taken at 1:25 pm PDT August 13, 2012. Developing thunderstorms surround Needles, CA, and the line of clouds to the southwest of the city would develop into a thunderstorm that brought rain to the city at 4 pm PDT, at a temperature of 115°F and a relative humidity of 11%--both world records. Image credit: NASA.
New country and territory hottest temperature records set in 2012
Five nations and two territories tied or set their hottest temperature readings in recorded history during 2012; no coldest all-time national records were set. For comparison, Seven countries and one territory set all-time hottest temperature records in 2011, and one nation set an all-time coldest temperature record. The most all-time national heat records in a year occurred in 2010, when twenty nations and one territory did so. Here are the 2012 national heat records:
Morocco recorded its hottest temperature on record on July 17, 2012 in Marrakech, when the mercury hit 49.6°C (121.3°F).
Kuwait recorded its hottest temperature on record on July 31, 2012 in Sulaibya, when the mercury hit 53.6°C (128.5°F). This surpasses the highest undisputed temperature ever recorded in Asia--the 53.5°C (128.3°F) measured at Moen Jo-Daro, Pakistan on May 26, 2010. The only higher temperature ever measured in Asia was a 54°C (129.2°F) reading from Tirat Tsvi, Israel on June 22, 1942. The Israeli Met Office pursued an investigation of the record in 2012 (prompted by an inquiry from the WMO and wunderground's weather historian Christopher C. Burt), and concluded that the record was valid. However, they have refused to make public the details leading to their conclusions, and until they do so, the record remains suspect.
Moldova recorded its hottest temperature on record on August 7, 2012 in Falesti, when the mercury hit 42.4°C (108.3°F).
Montenegro tied its hottest temperature on record on August 8, 2012 in Danilovgrad, when the mercury hit 44.8°C (112.6°F).
The Czech Republic recorded its hottest temperature on record on August 20, 2012 in Dobrichovice, when the mercury hit 40.4°C (104.7°F).
The territory of Hong Kong tied its hottest temperature on record on July 21 on Ping Chau Island, when the mercury hit 37.7°C (99.9°F).
The Sprska Republic set a new territorial high of 42.8°C (109°F) on August 24 at Visegrad.
New U.S. State Records set in 2012
New state record high: South Carolina, at Columbia University WS and Johnston, 45.0°C (113°F), June 29
State record high temperature tied: Colorado, at Las Animas, 45.6°C (114°F), June 23
Wunderground's weather historian Christopher C. Burt maintains a database of national heat and cold records on wunderground.com's extremes page, where all of this year's national heat records are updated. Weather records researcher Maximiliano Herrera is the primary source of these national weather records.
How much of the warming in recent decades is due to natural causes?
The El Niño/La Niña cycle causes cyclical changes in global temperatures that average out close to zero over the course of several decades. La Niña events bring a large amount of cold water to the surface in the equatorial Eastern Pacific, which cools global temperatures by up to 0.2°C. El Niño events have the opposite effect. During 2012, a weak La Niña event was present through March. Warming of the Eastern Pacific waters in the spring brought on neutral conditions, which lasted for the remainder of the year. The year 2012 was the warmest year on record when a La Niña event was present, surpassing the previous record set just the year before, in 2011. Global temperatures were 0.09°C (0.16°F) cooler than the record warmest year for the planet (2010), and 2012 would very likely have been the warmest on record had an El Niño event been present instead of a La Niña, as seen by looking at the year-to-date global temperature plot for 2012.
Figure 3. Departure from average of annual global temperatures between 1950 - 2012, classified by phase of the El Niño-Southern Oscillation (ENSO). The year 2012 was the warmest year on record when a La Niña event was present. ENSO is a natural episodic fluctuation in sea surface temperature (El Niño/La Niña) and the air pressure of the overlying atmosphere (Southern Oscillation) across the equatorial Pacific Ocean. Over a period of months to a few years, ENSO fluctuates between warmer-than-average ocean surface waters (El Niño) and cooler-than-average ocean surface waters (La Niña) in that region. Earth's warmest years tend to occur when an El Niño is present; cooler years occur when a La Niña is occurring. A La Niña (El Niño) year is defined here as occurring when the first three months of a calendar year meet the La Niña (El Niño) criteria as defined by NOAA's Climate Prediction Center. Image credit: National Climatic Data Center.
Correcting for natural causes to find the human contribution
We know that natural episodes of global warming or cooling in the distant past have been caused by changes in sunlight and volcanic dust. So, it is good to remove these natural causes of global temperature change over the past 34 years we have satellite data, to see what the human influence might have been during that time span. Through 2010, the three major research groups that maintain global surface temperature data sets (NCDC, GISS, and HadCRU) all show global temperatures have warmed by 0.16 - 0.17°C (0.28 - 0.30°F) per decade since satellite measurements began in 1979. The two satellite-based data sets of the lower atmosphere (maintained by UAH and RSS) give slightly less warming, about 0.14 - 0.15°C (.25 - .27°F) per decade (keep in mind that satellite measurements of the lower atmosphere temperature are affected much more strongly by volcanic eruptions and the El Niño phenomena than are surface-based measurements taken by weather stations.) A 2011 paper published by Grant Foster and Stefan Rahmstorf, Global temperature evolution 1979 - 2010, took these five major global temperature data sets and adjusted them to remove the influences of natural variations in sunlight, volcanic dust, and the El Niño/La Niña cycle. The researchers found that adjusting for these natural effects did not change the observed trend in global temperatures, which remained between 0.14 - 0.17°C (0.25 - 0.31°F) per decade in all five data sets. The warmest years since 1979 were 2010 and 2009 in all five adjusted data sets. The known natural causes of global warming have little to do with the observed increase in global temperatures over the past 34 years, and the vast majority of actively publishing climate scientists agree that human activity is the primary cause of increasing global temperatures in recent decades.
Figure 4. Departure from average of annual global temperatures between 1979 - 2010, adjusted to remove natural variations due to fluctuations in the El Niño-Southern Oscillation (ENSO) cycle, dust from volcanic eruptions, and changes in sunlight. The five most frequently-cited global temperature records are presented: surface temperature estimates by NASA's GISS, HadCRU from the UK, and NOAA's NCDC, and satellite-based lower-atmosphere estimates from Remote Sensing Systems, Inc. (RSS) and the University of Alabama Huntsville (UAH.) Image credit Global temperature evolution 1979- 2010 by Grant Foster and Stefan Rahmstorf, Environ. Res. Lett. 6, 2011, 044022 doi:10.1088/1748-9326/6/4/044022.
Video 1. Human emissions of heat-trapping gases like carbon dioxide have continued to warm the planet over the past 16 years. However, a persistent myth has emerged in the mainstream media challenging this. Denial of this fact may have been the favorite climate contrarian myth of 2012. Video courtesy of skepticalscience.com.
Top Ten Weather Lists for 2012
My Top Ten Global Weather Events of 2012
My Top Ten U.S. Weather Events of 2012.
NCDC's Top Ten Annual Weather/Climate Events
Wunderground's Angela Fritz's has a list of Top Climate Events of 2012.
A group of seventeen climate scientists and climate bloggers created a Climate Disruption: Critical 2012 Events and Stories list of 19 key climate change events that occurred in 2012.
TWC's Stu Ostro has his annual post showing his pick for top weather images of 2012.
Climate Central has a top-ten most striking images of 2012 post.
Jeff Masters
Climate Summaries Climate Change
The views of the author are his/her own and do not necessarily represent the position of The Weather Company or its parent, IBM.